The "Element accumulation in the tank" function is a powerful analytical tool in Samomes that shows a theoretical forecast of nutrient buildup in your aquarium based on configured dosages.
Element dynamics charts help understand how fertilizer concentrations will change over time and when equilibrium state between nutrient availability and consumption will be reached. This function is directly linked to the "Dosing" section — any changes in dosages are instantly reflected in the charts and concentration forecasts.
Let's examine parameter analysis using the example of popular Dennerle Plant Care NPK and Dennerle Plant Care Pro fertilizers with a daily dose of 1 ml of each fertilizer.
Step-by-Step Guide
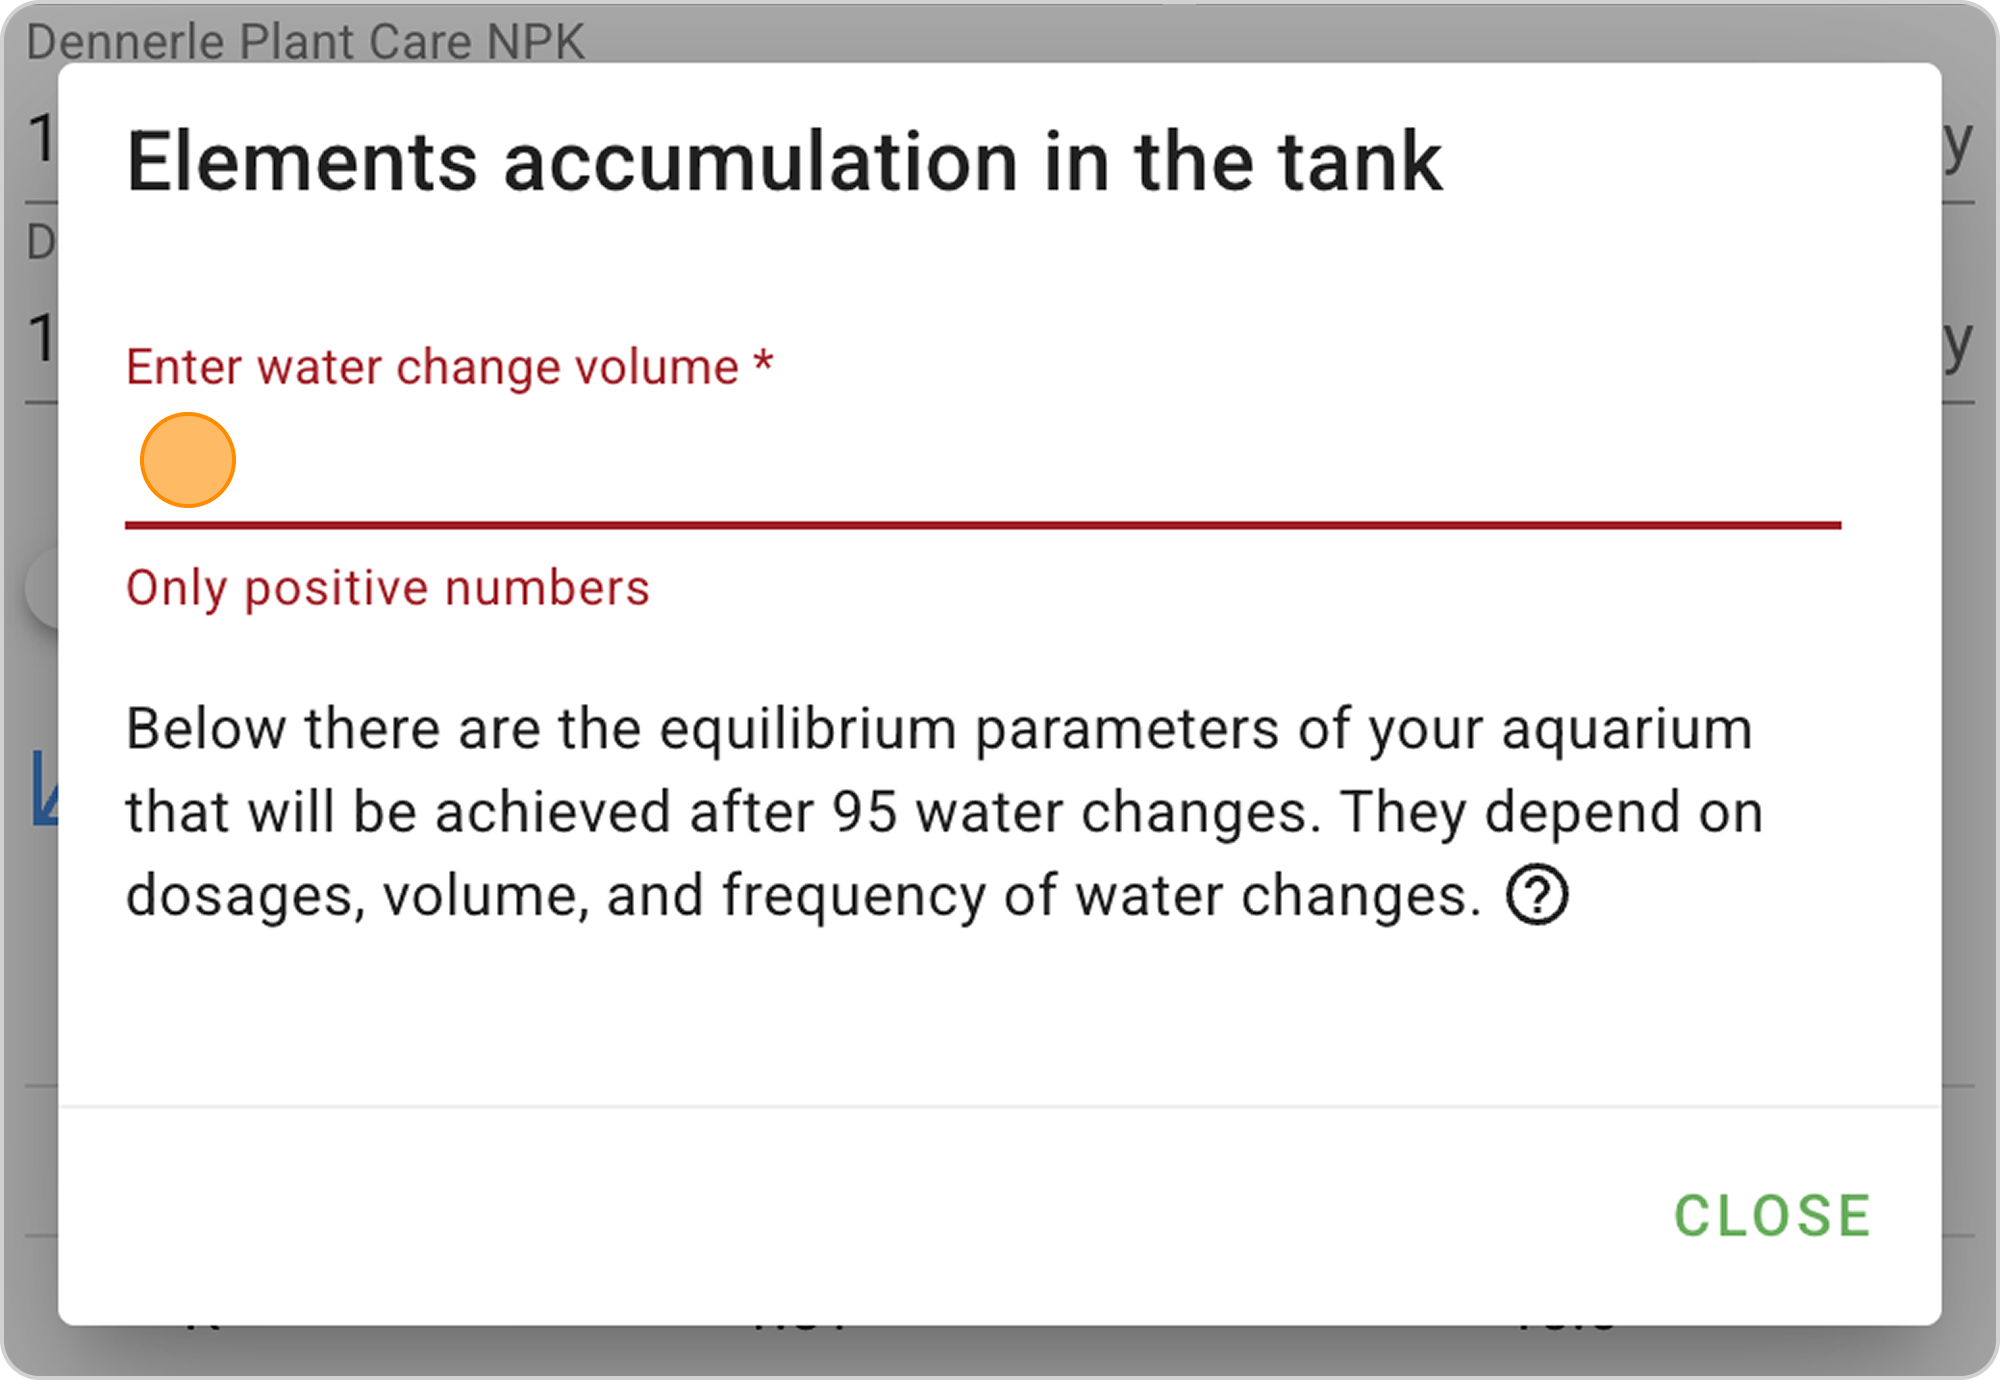
Step 1. Specify Water Change Volume
- Click the "Element accumulation in the tank" button and a popup window will open.
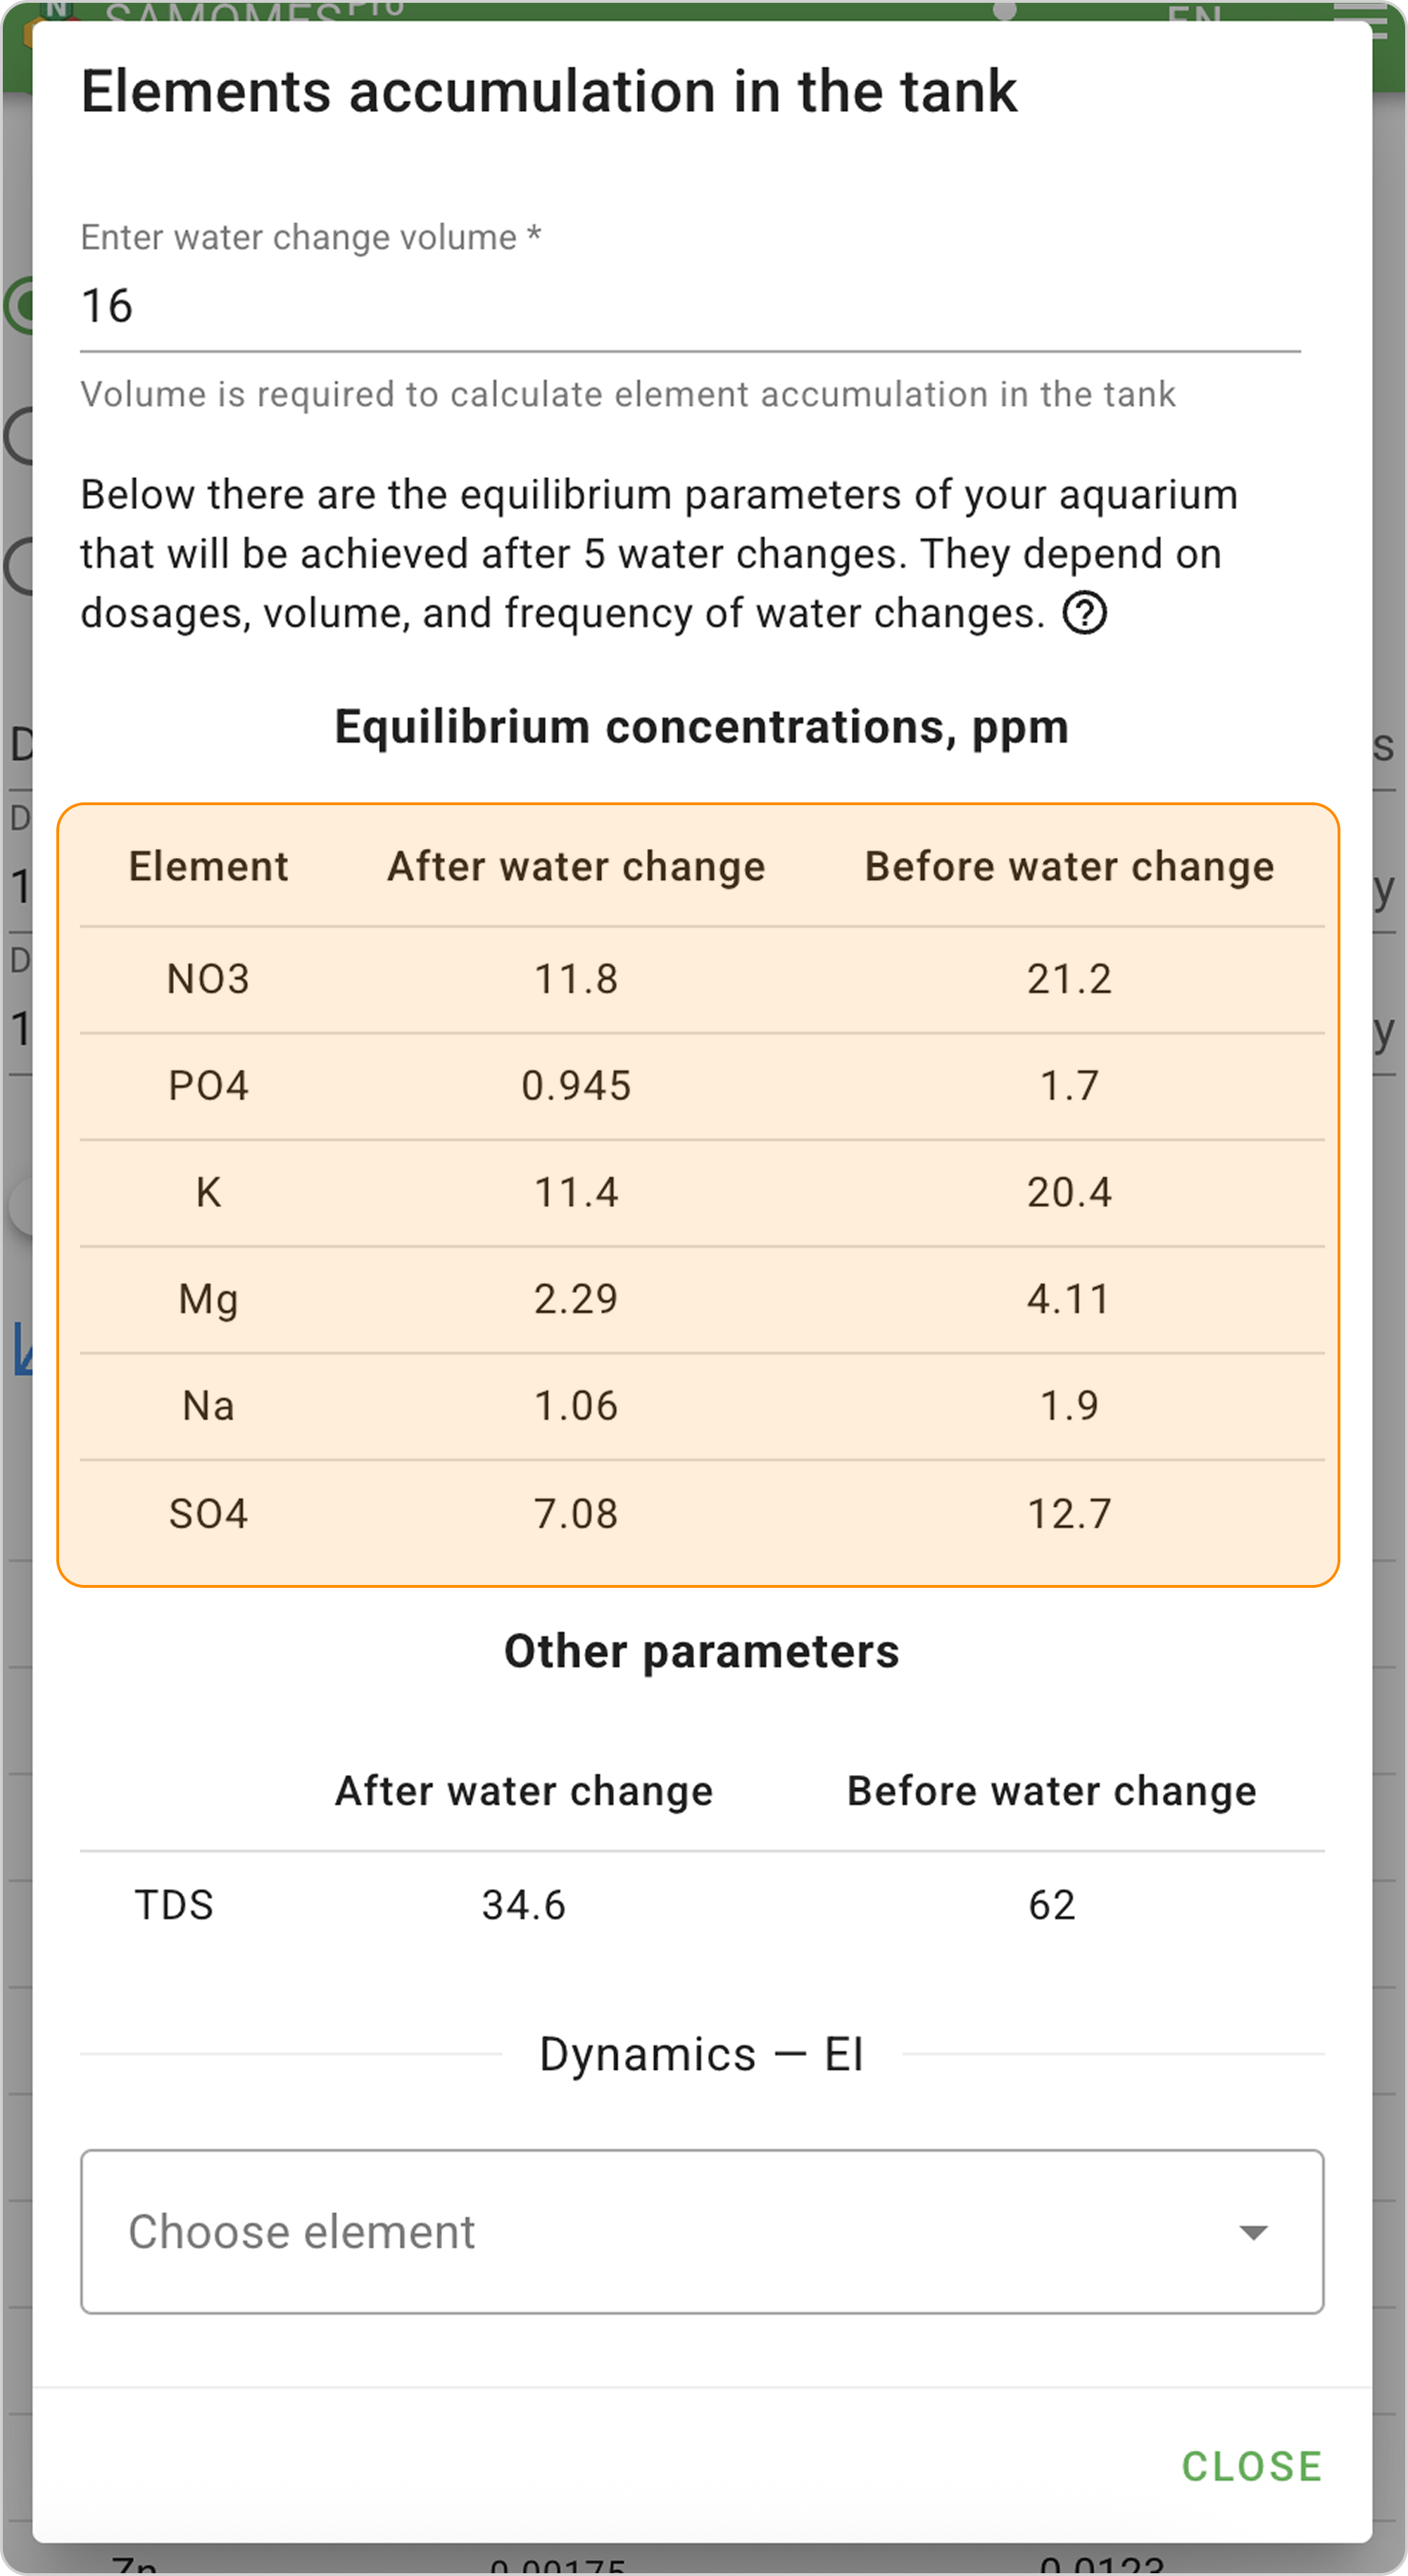
- In the "Enter water change volume" field, specify the number of liters of water you change weekly. In our example, enter "16 liters" in the field.
- After entering the water change volume, the Equilibrium Element Concentrations Table will appear. This table shows element concentrations when equilibrium is established in the aquarium.
Step 2. Select Element
- In the "Select element" dropdown list, you can switch between:
- NO3 — for nitrate analysis
- PO4 — for phosphate analysis
- K — for potassium analysis
- Mg — for magnesium analysis
- Na — for sodium analysis
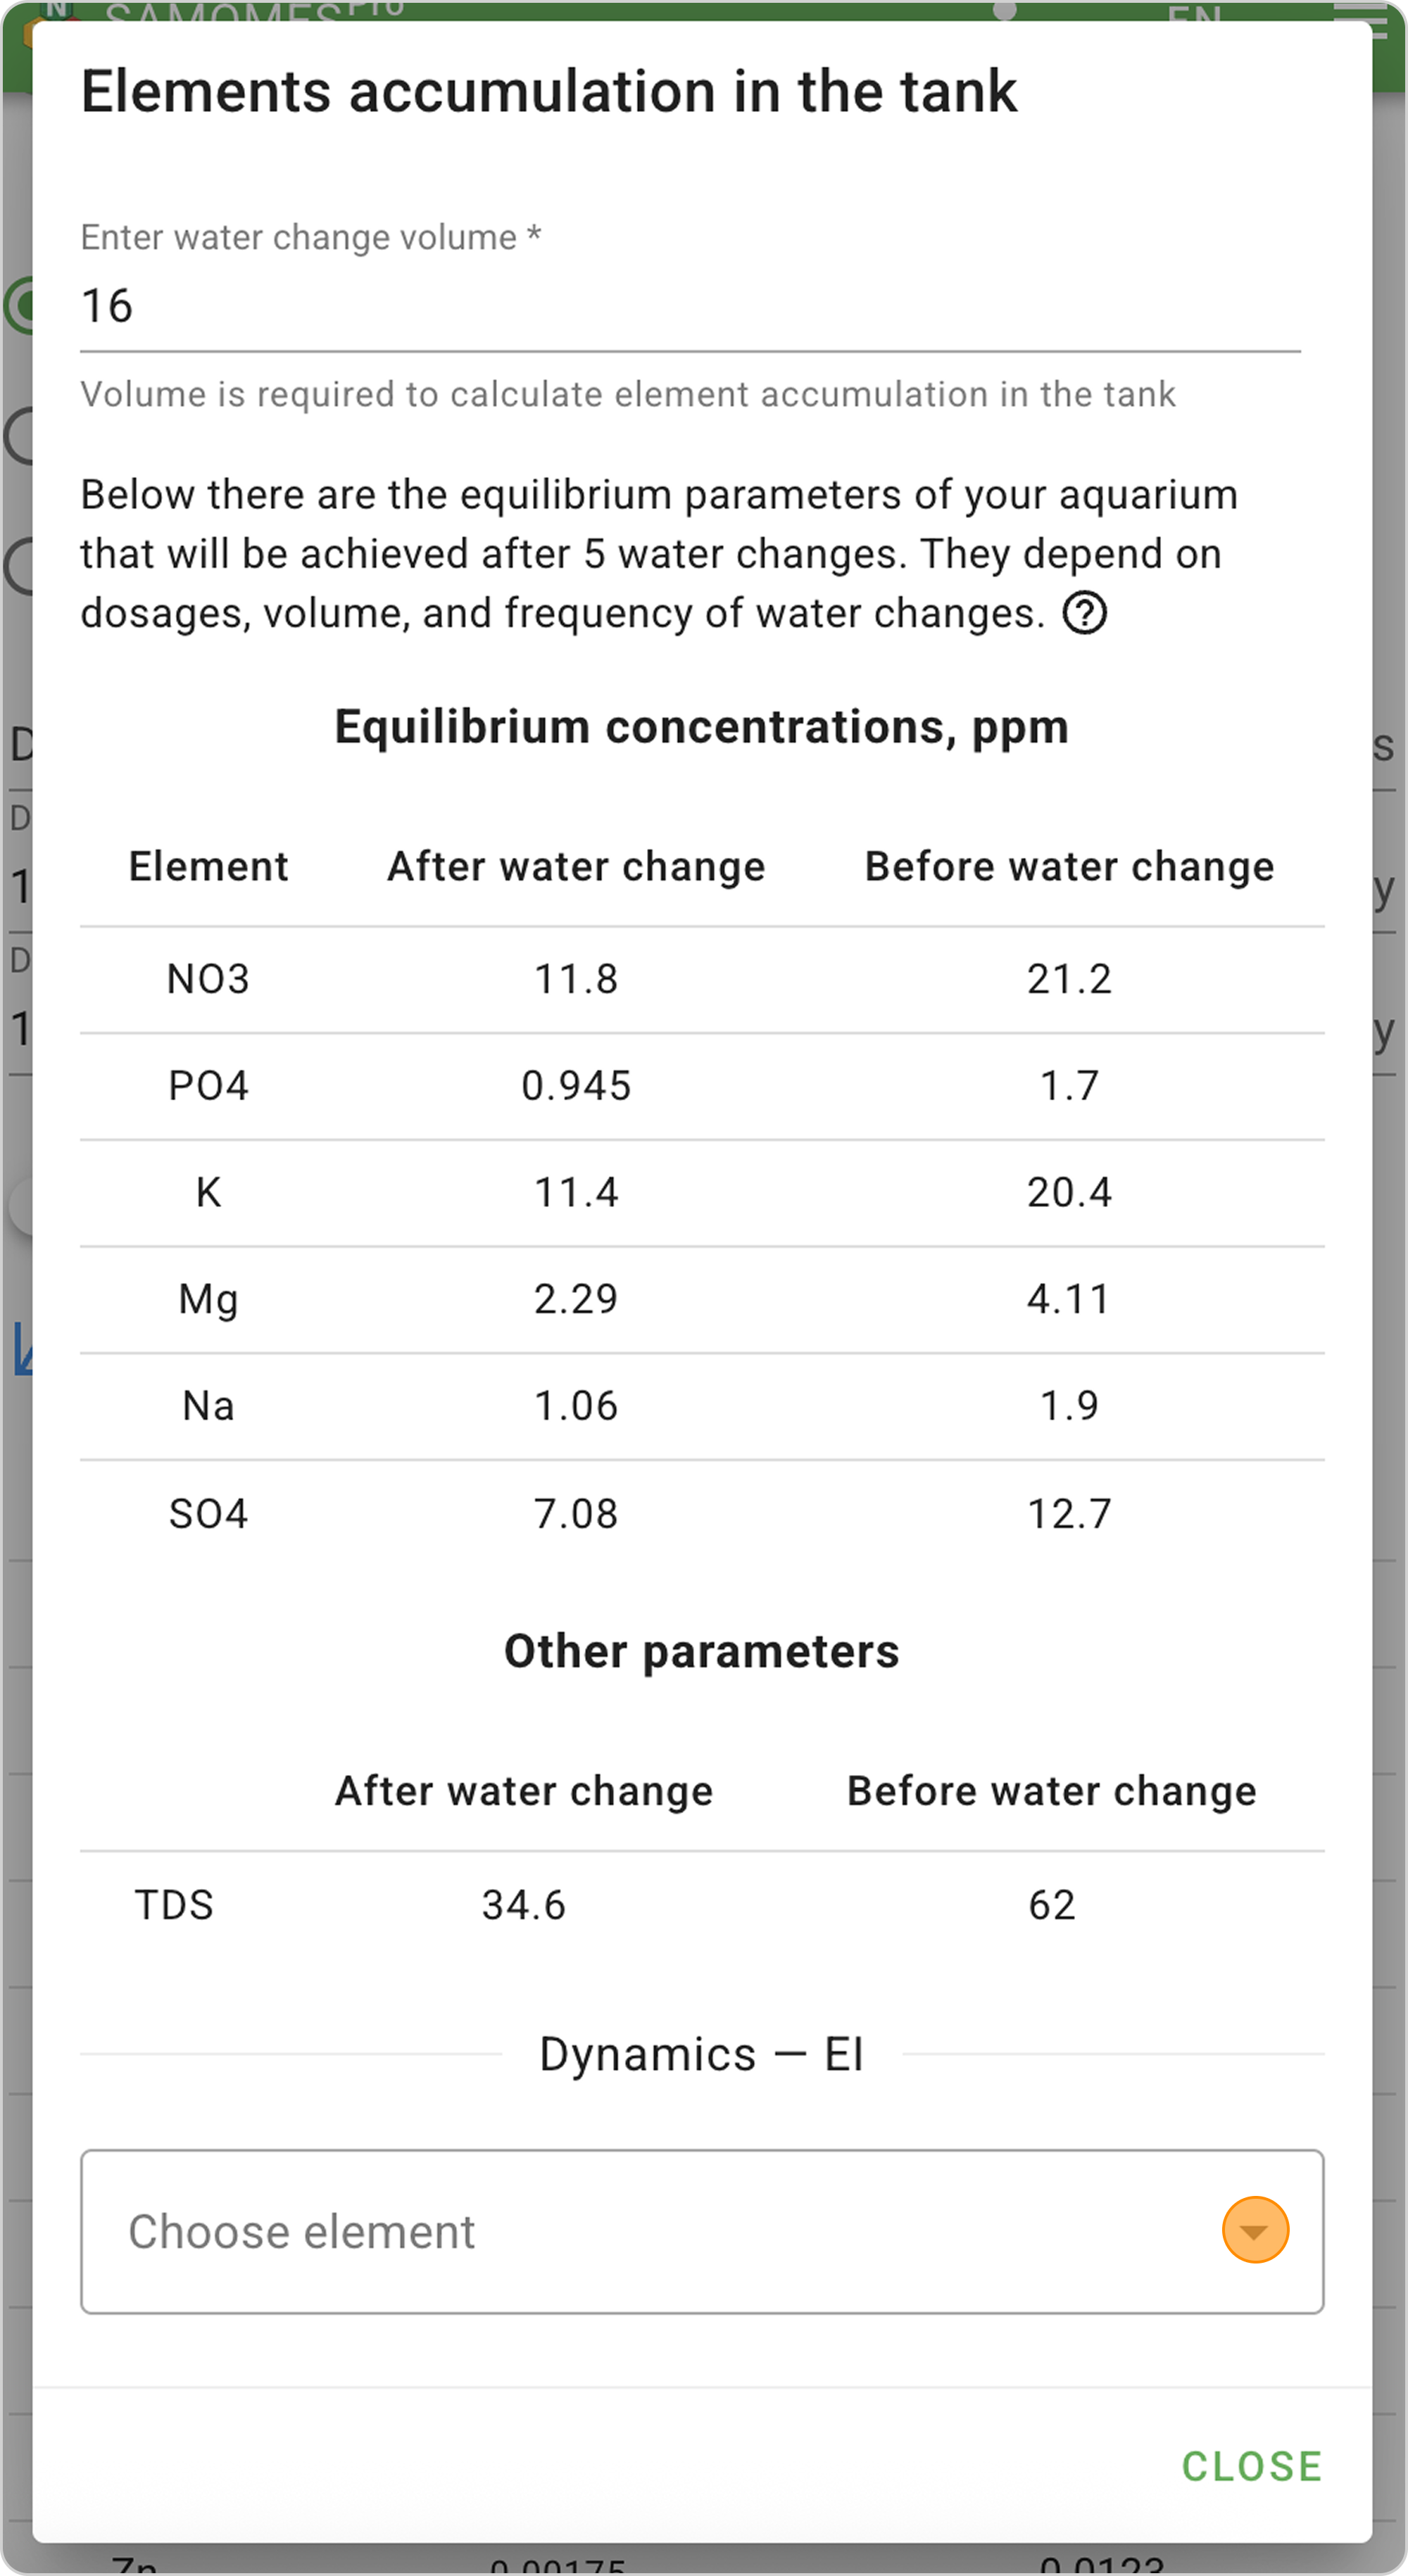
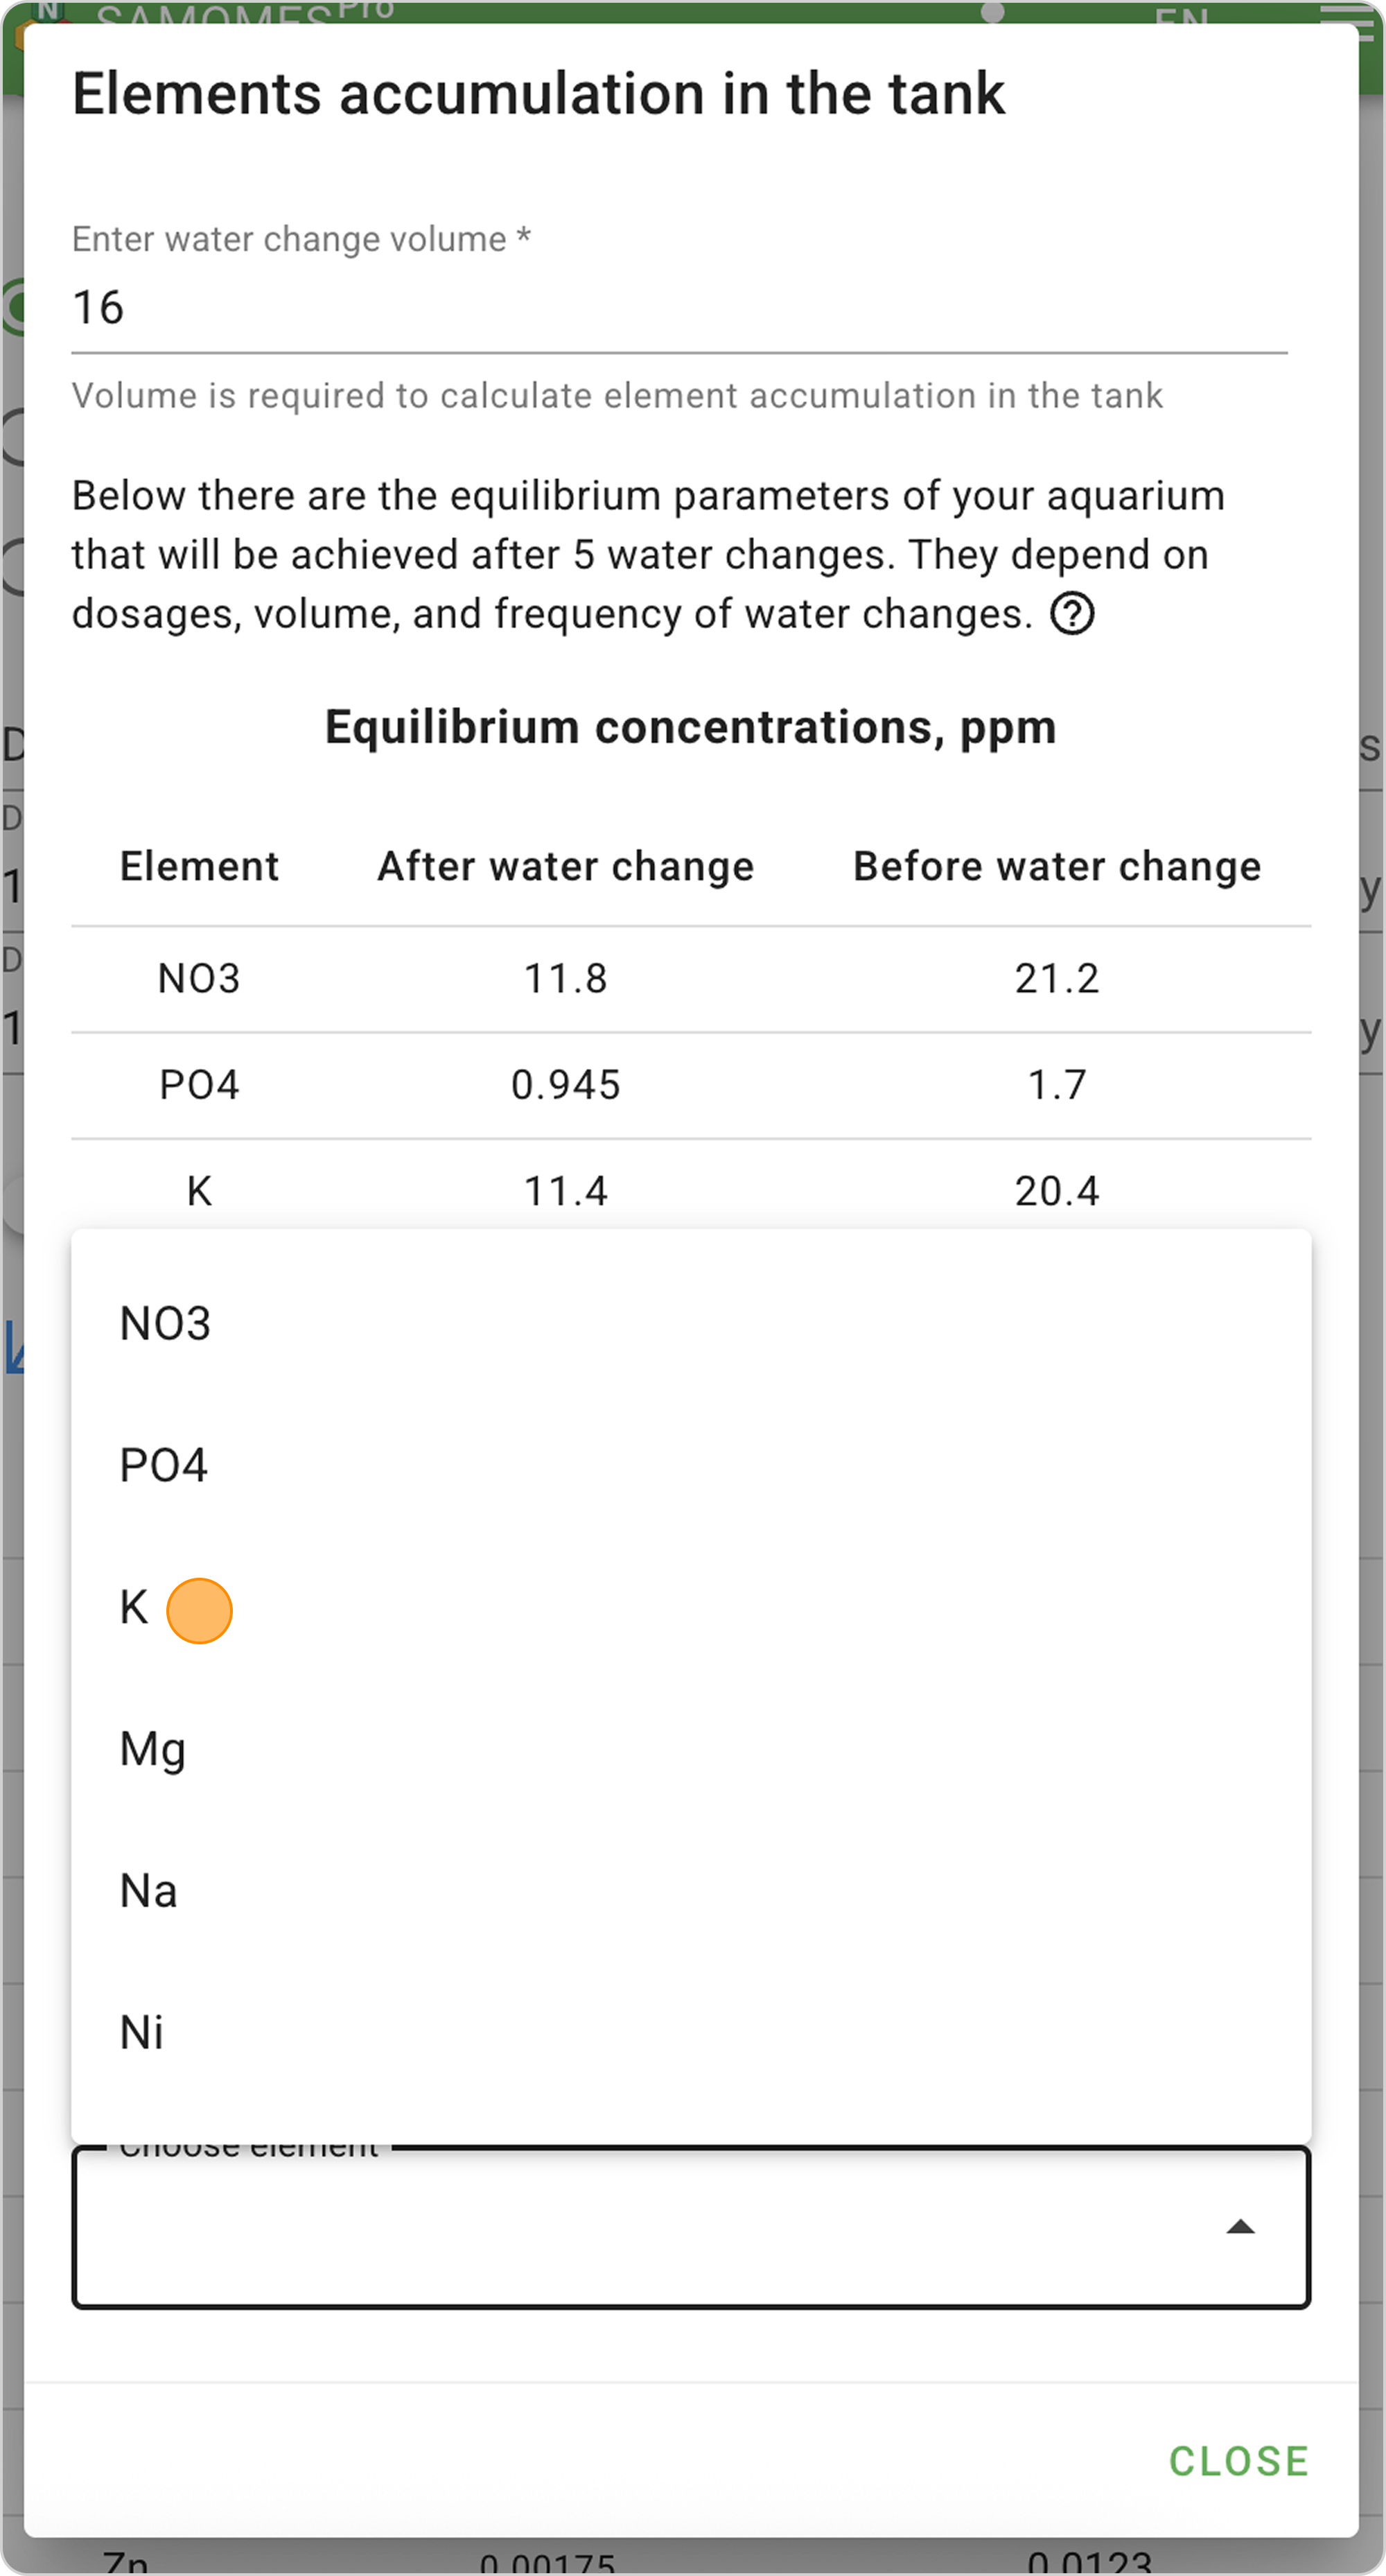
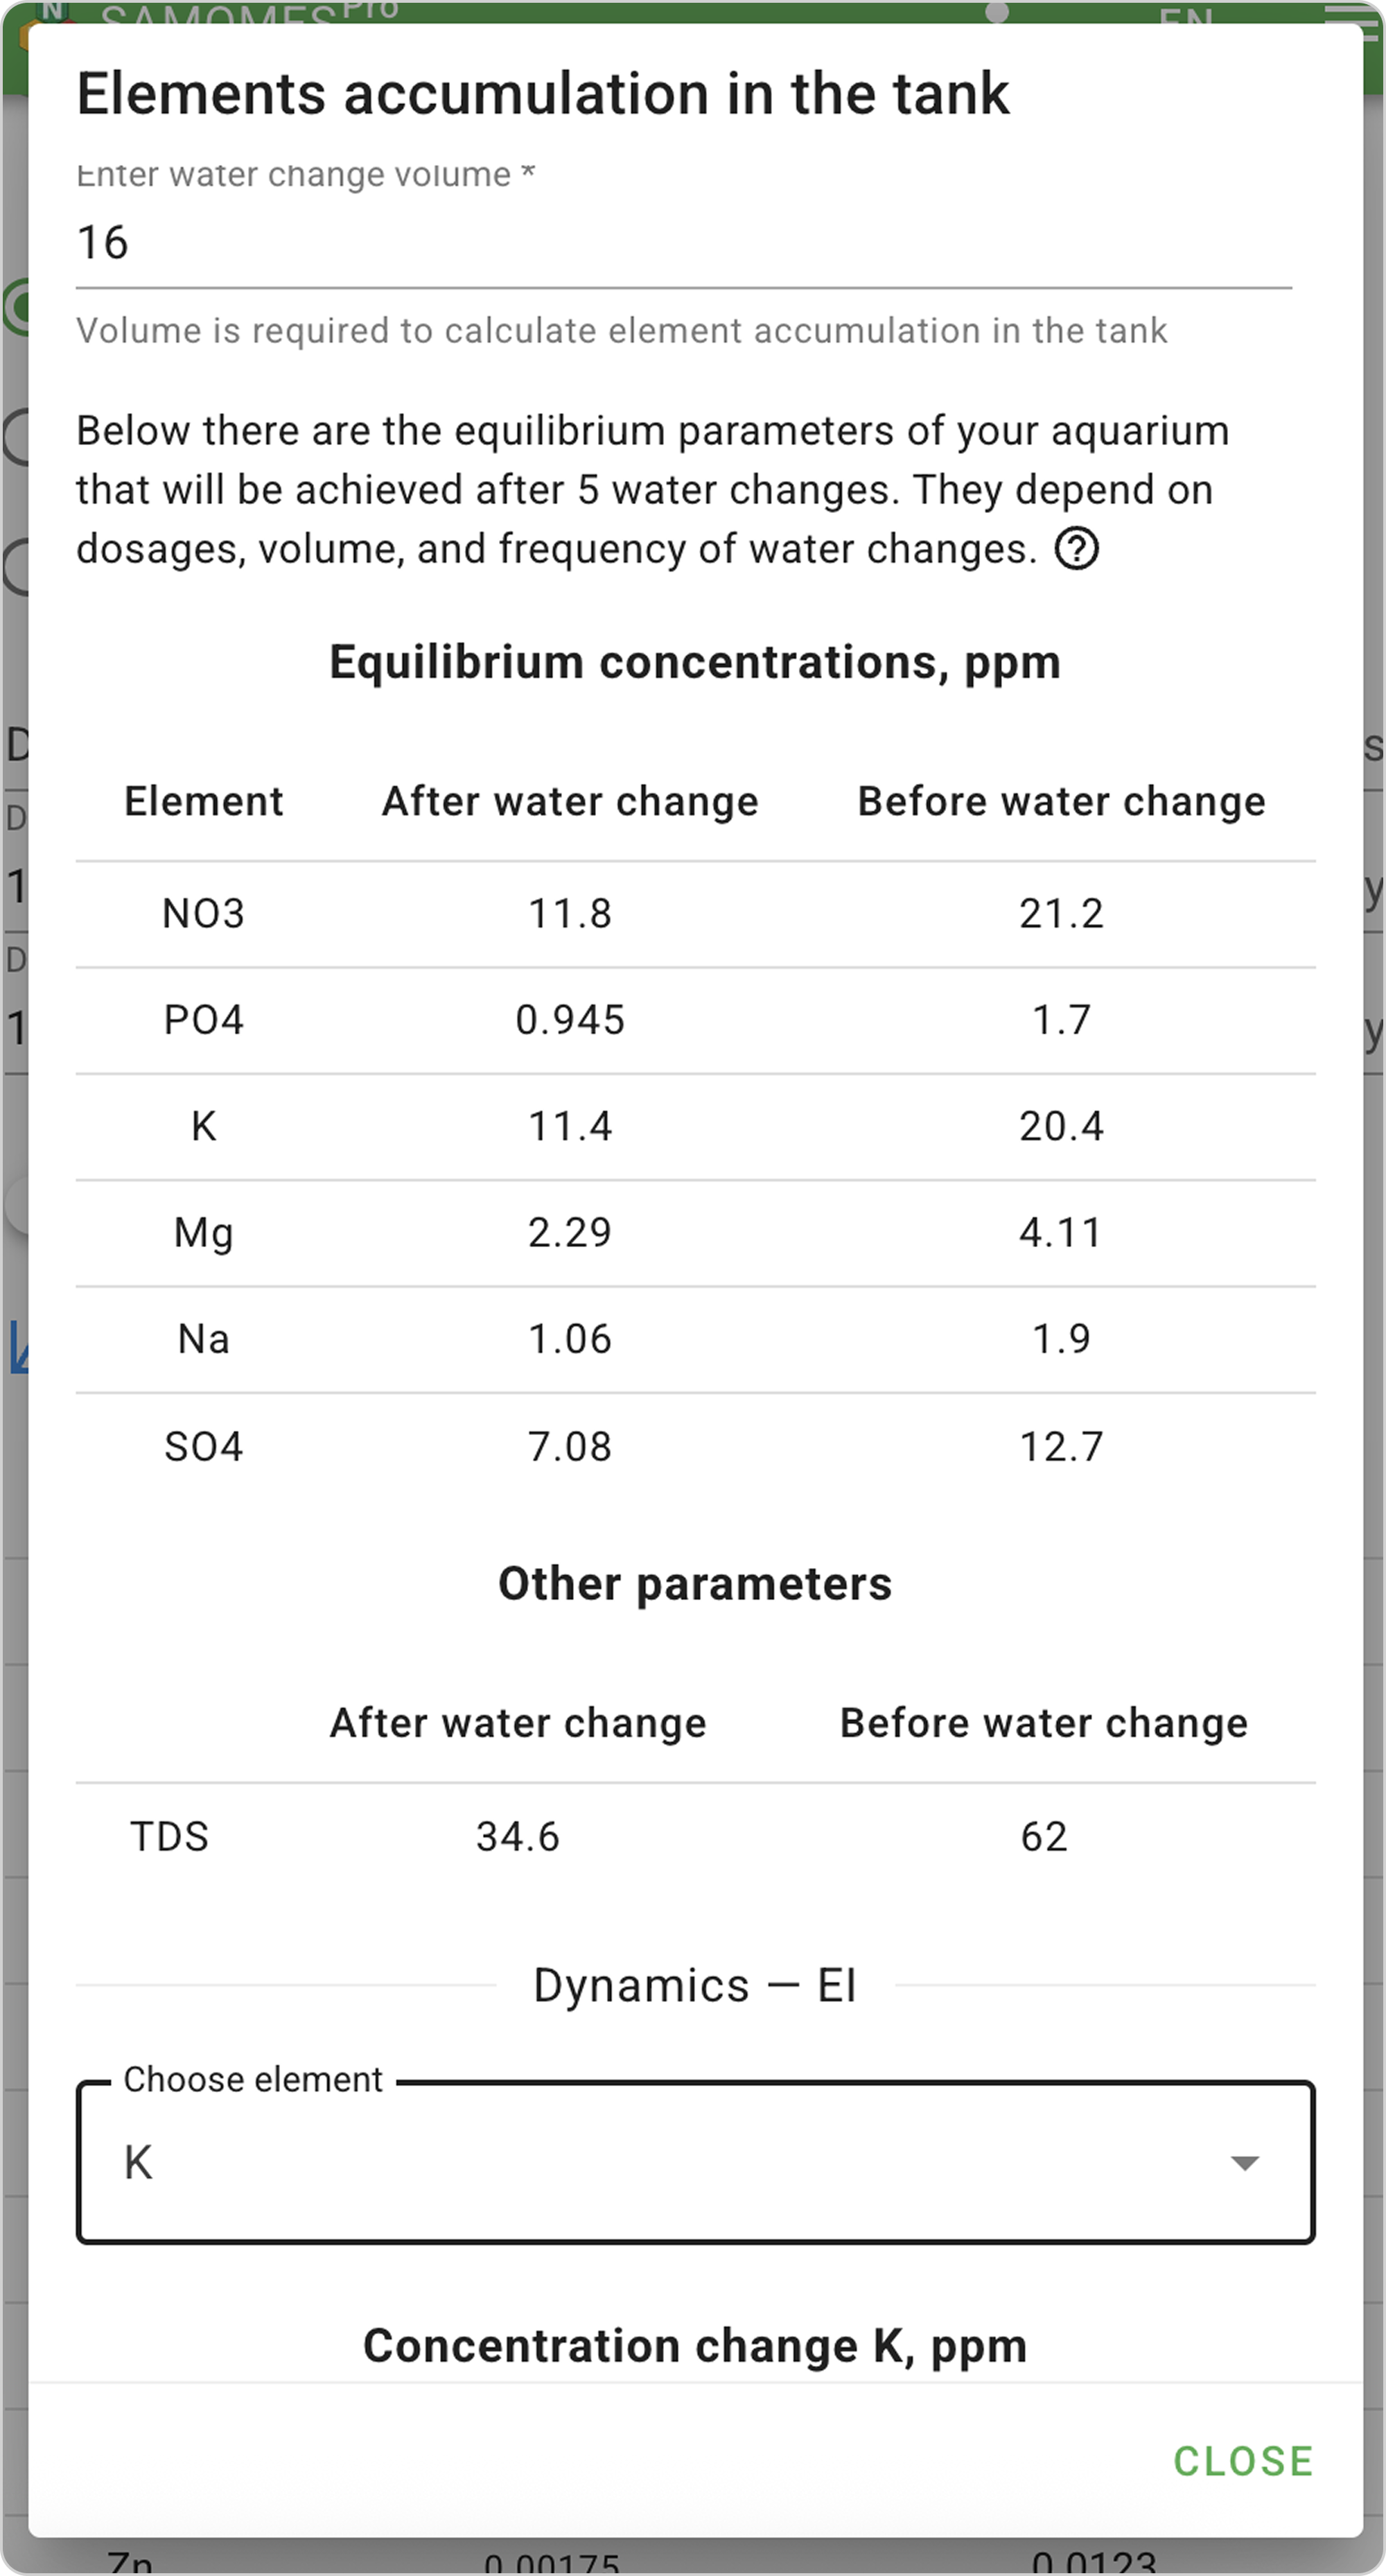
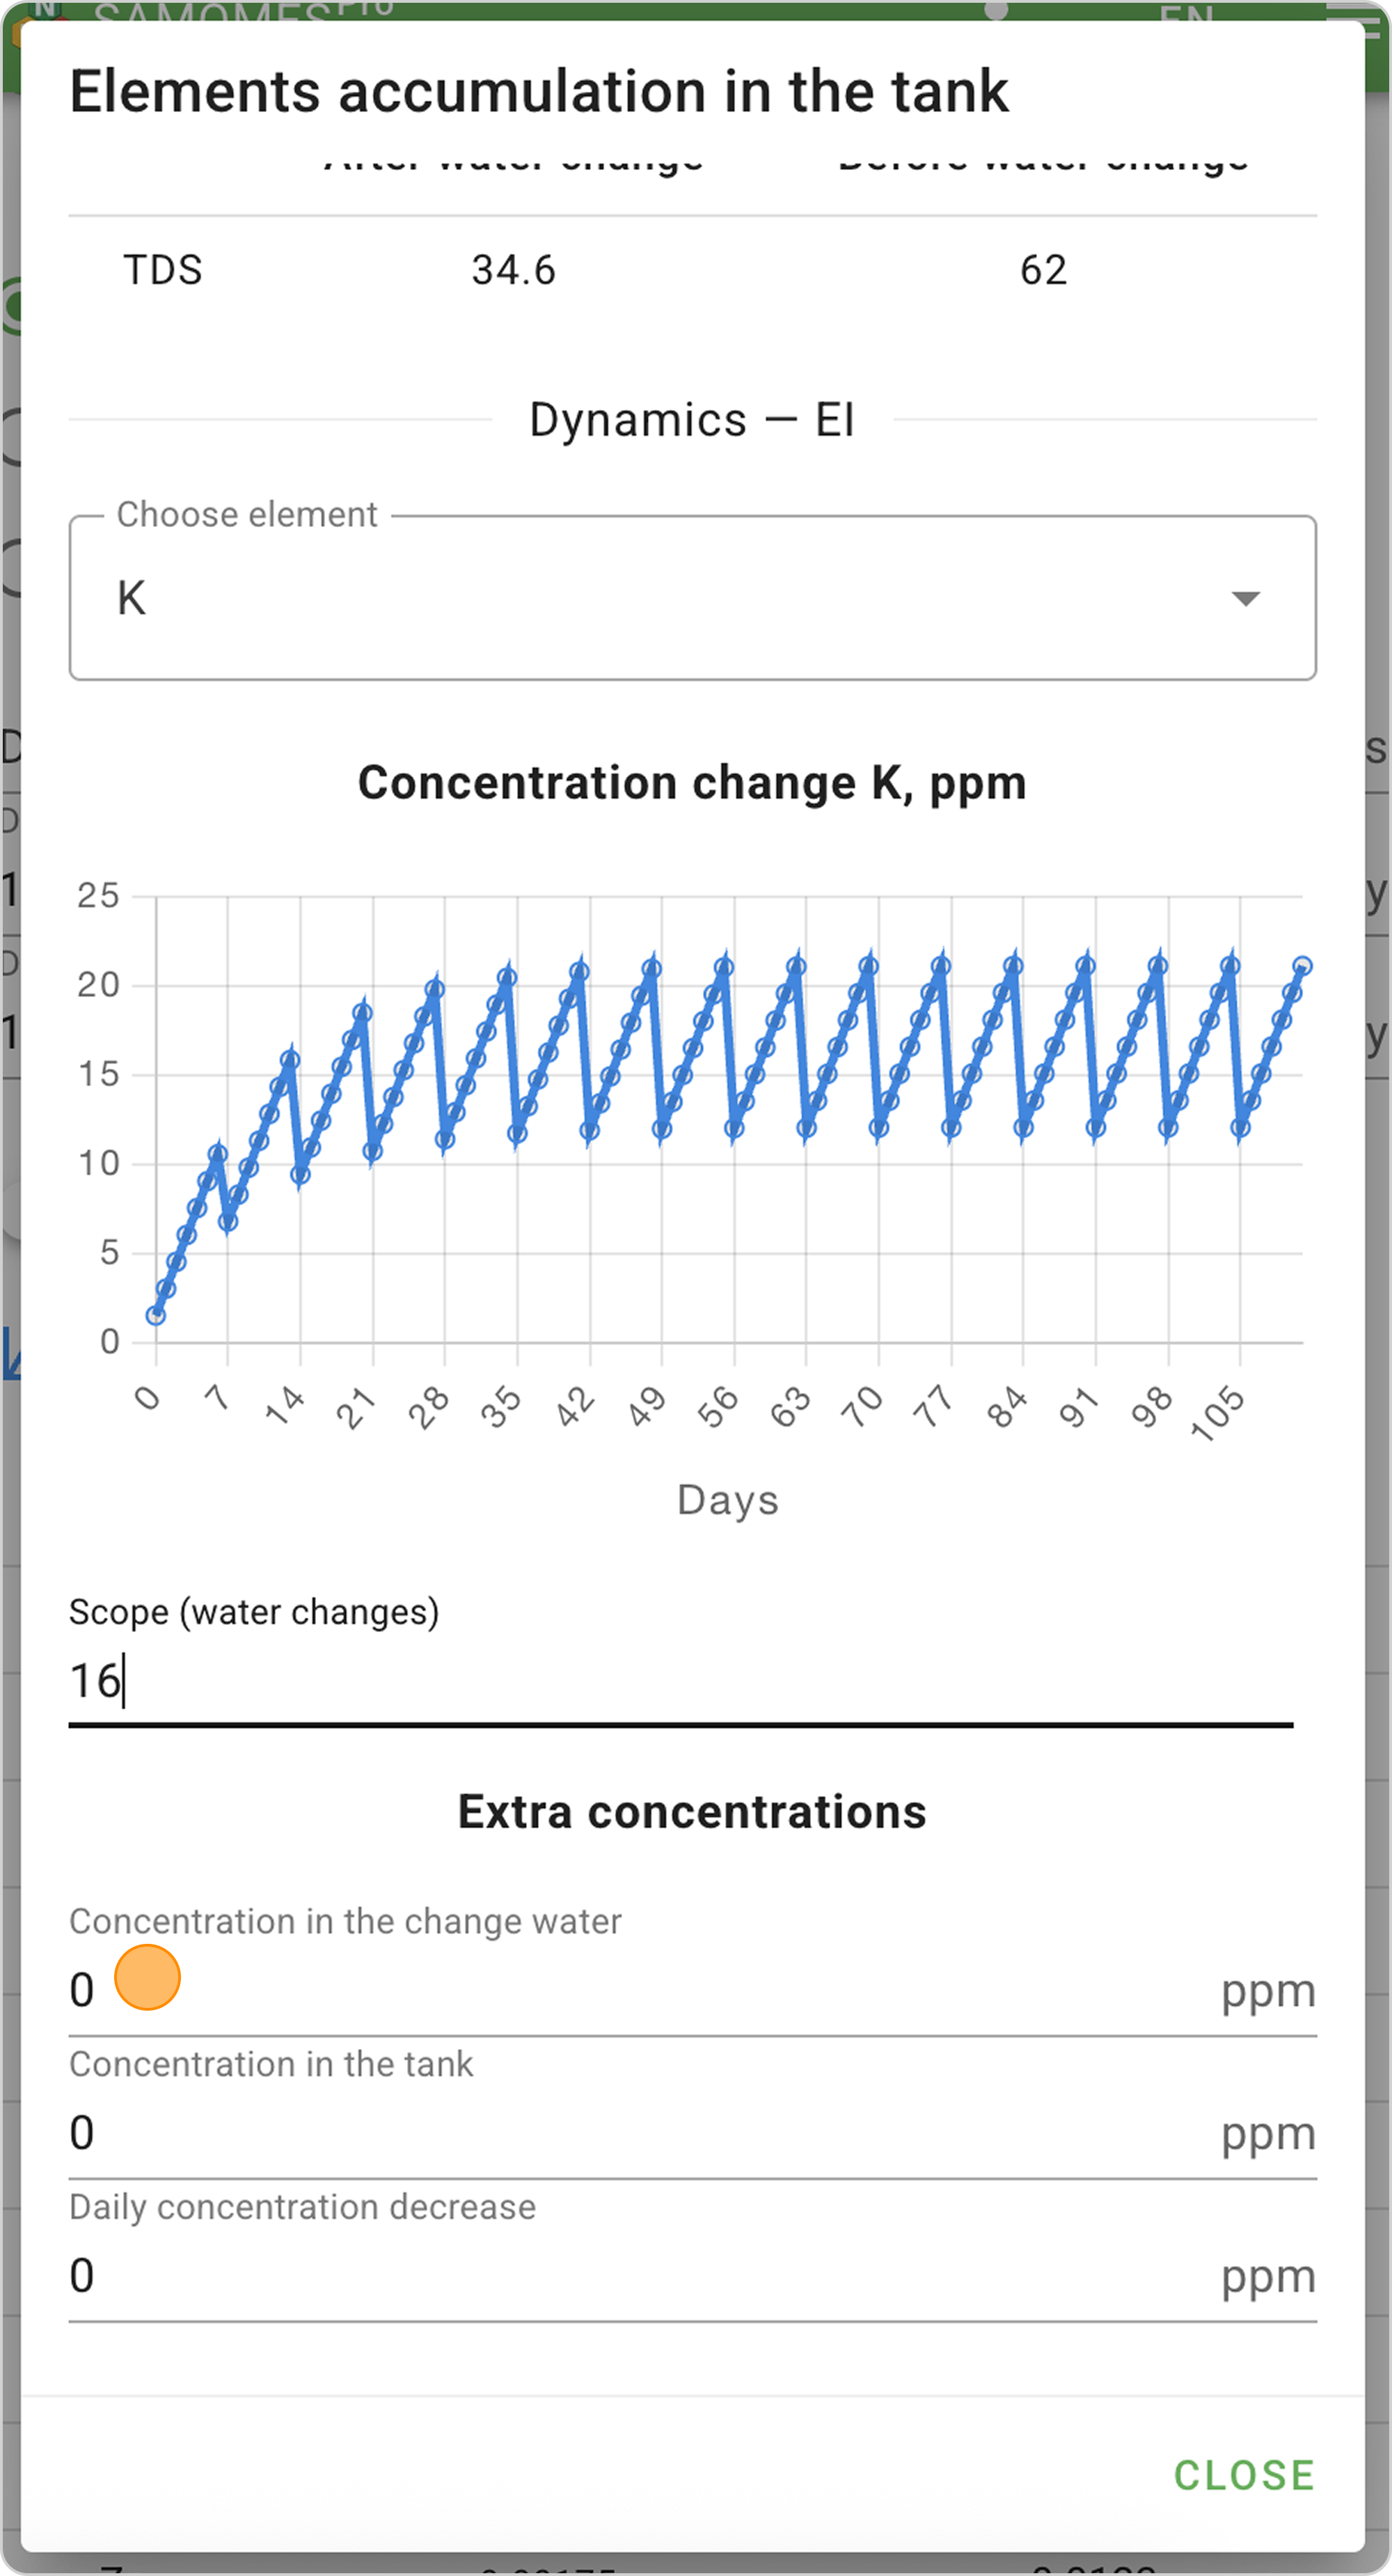
In our example: select element K (potassium) to view its equilibrium concentrations and dynamics of change in aquarium water.
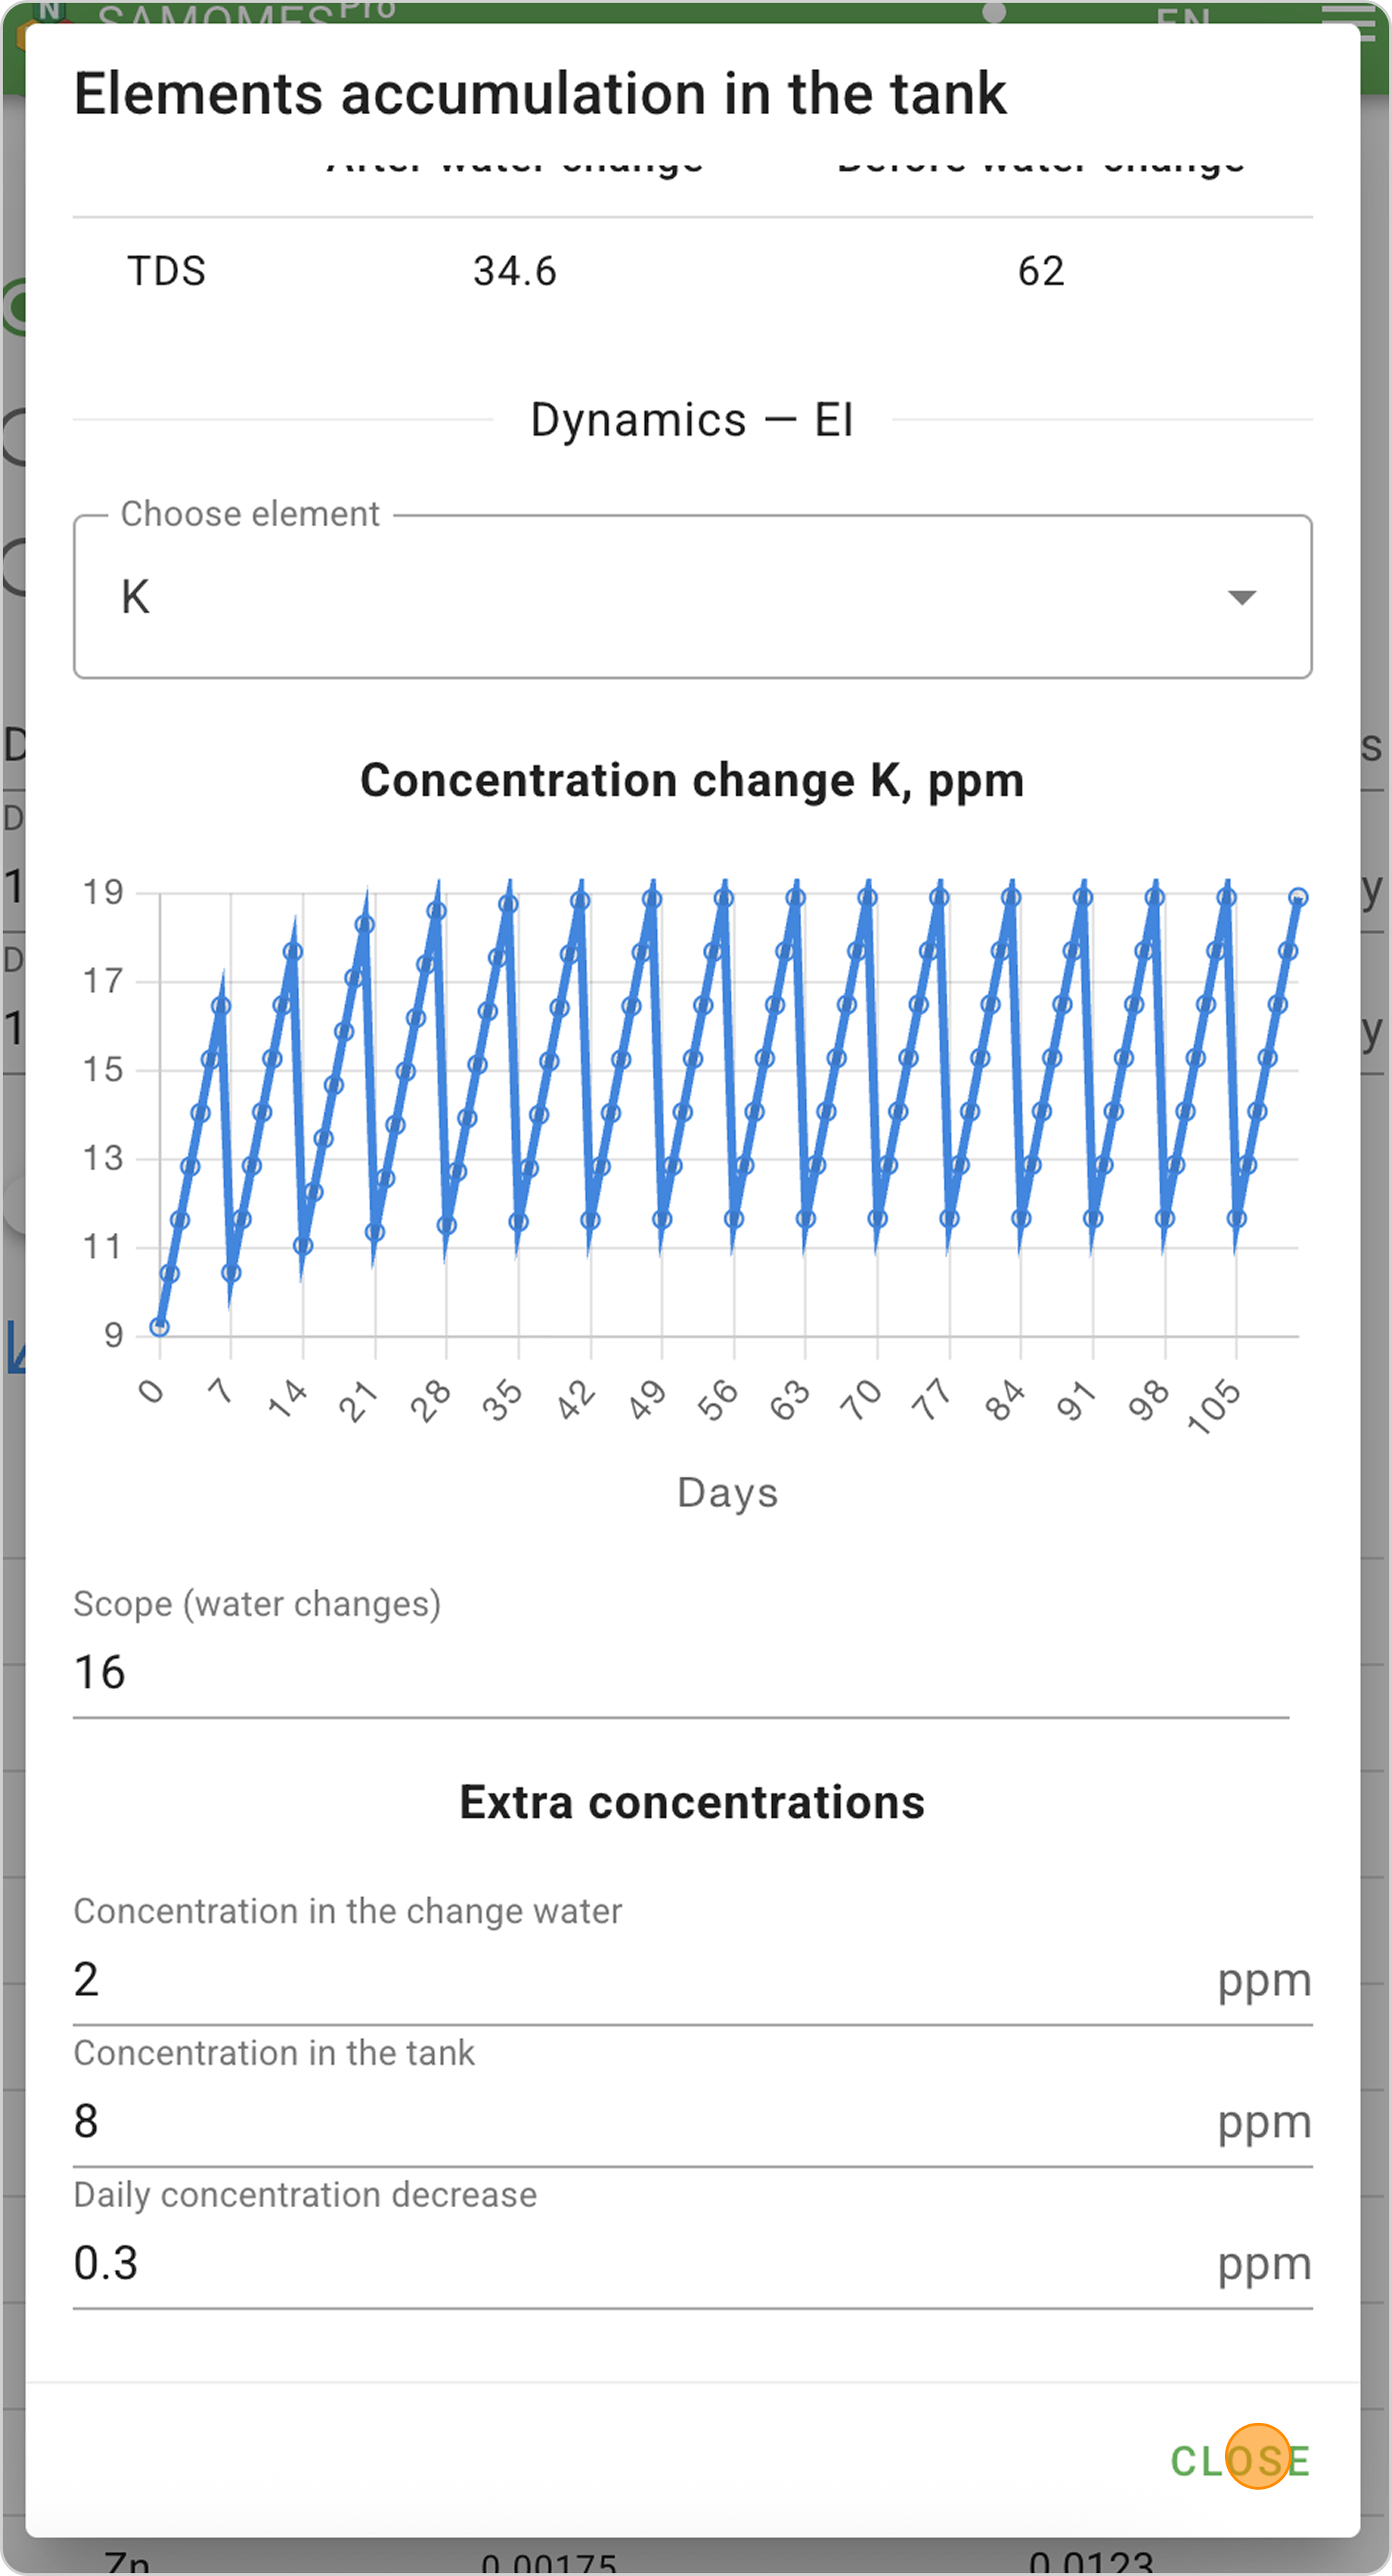
Step 3. Interpreting the Accumulation Graph
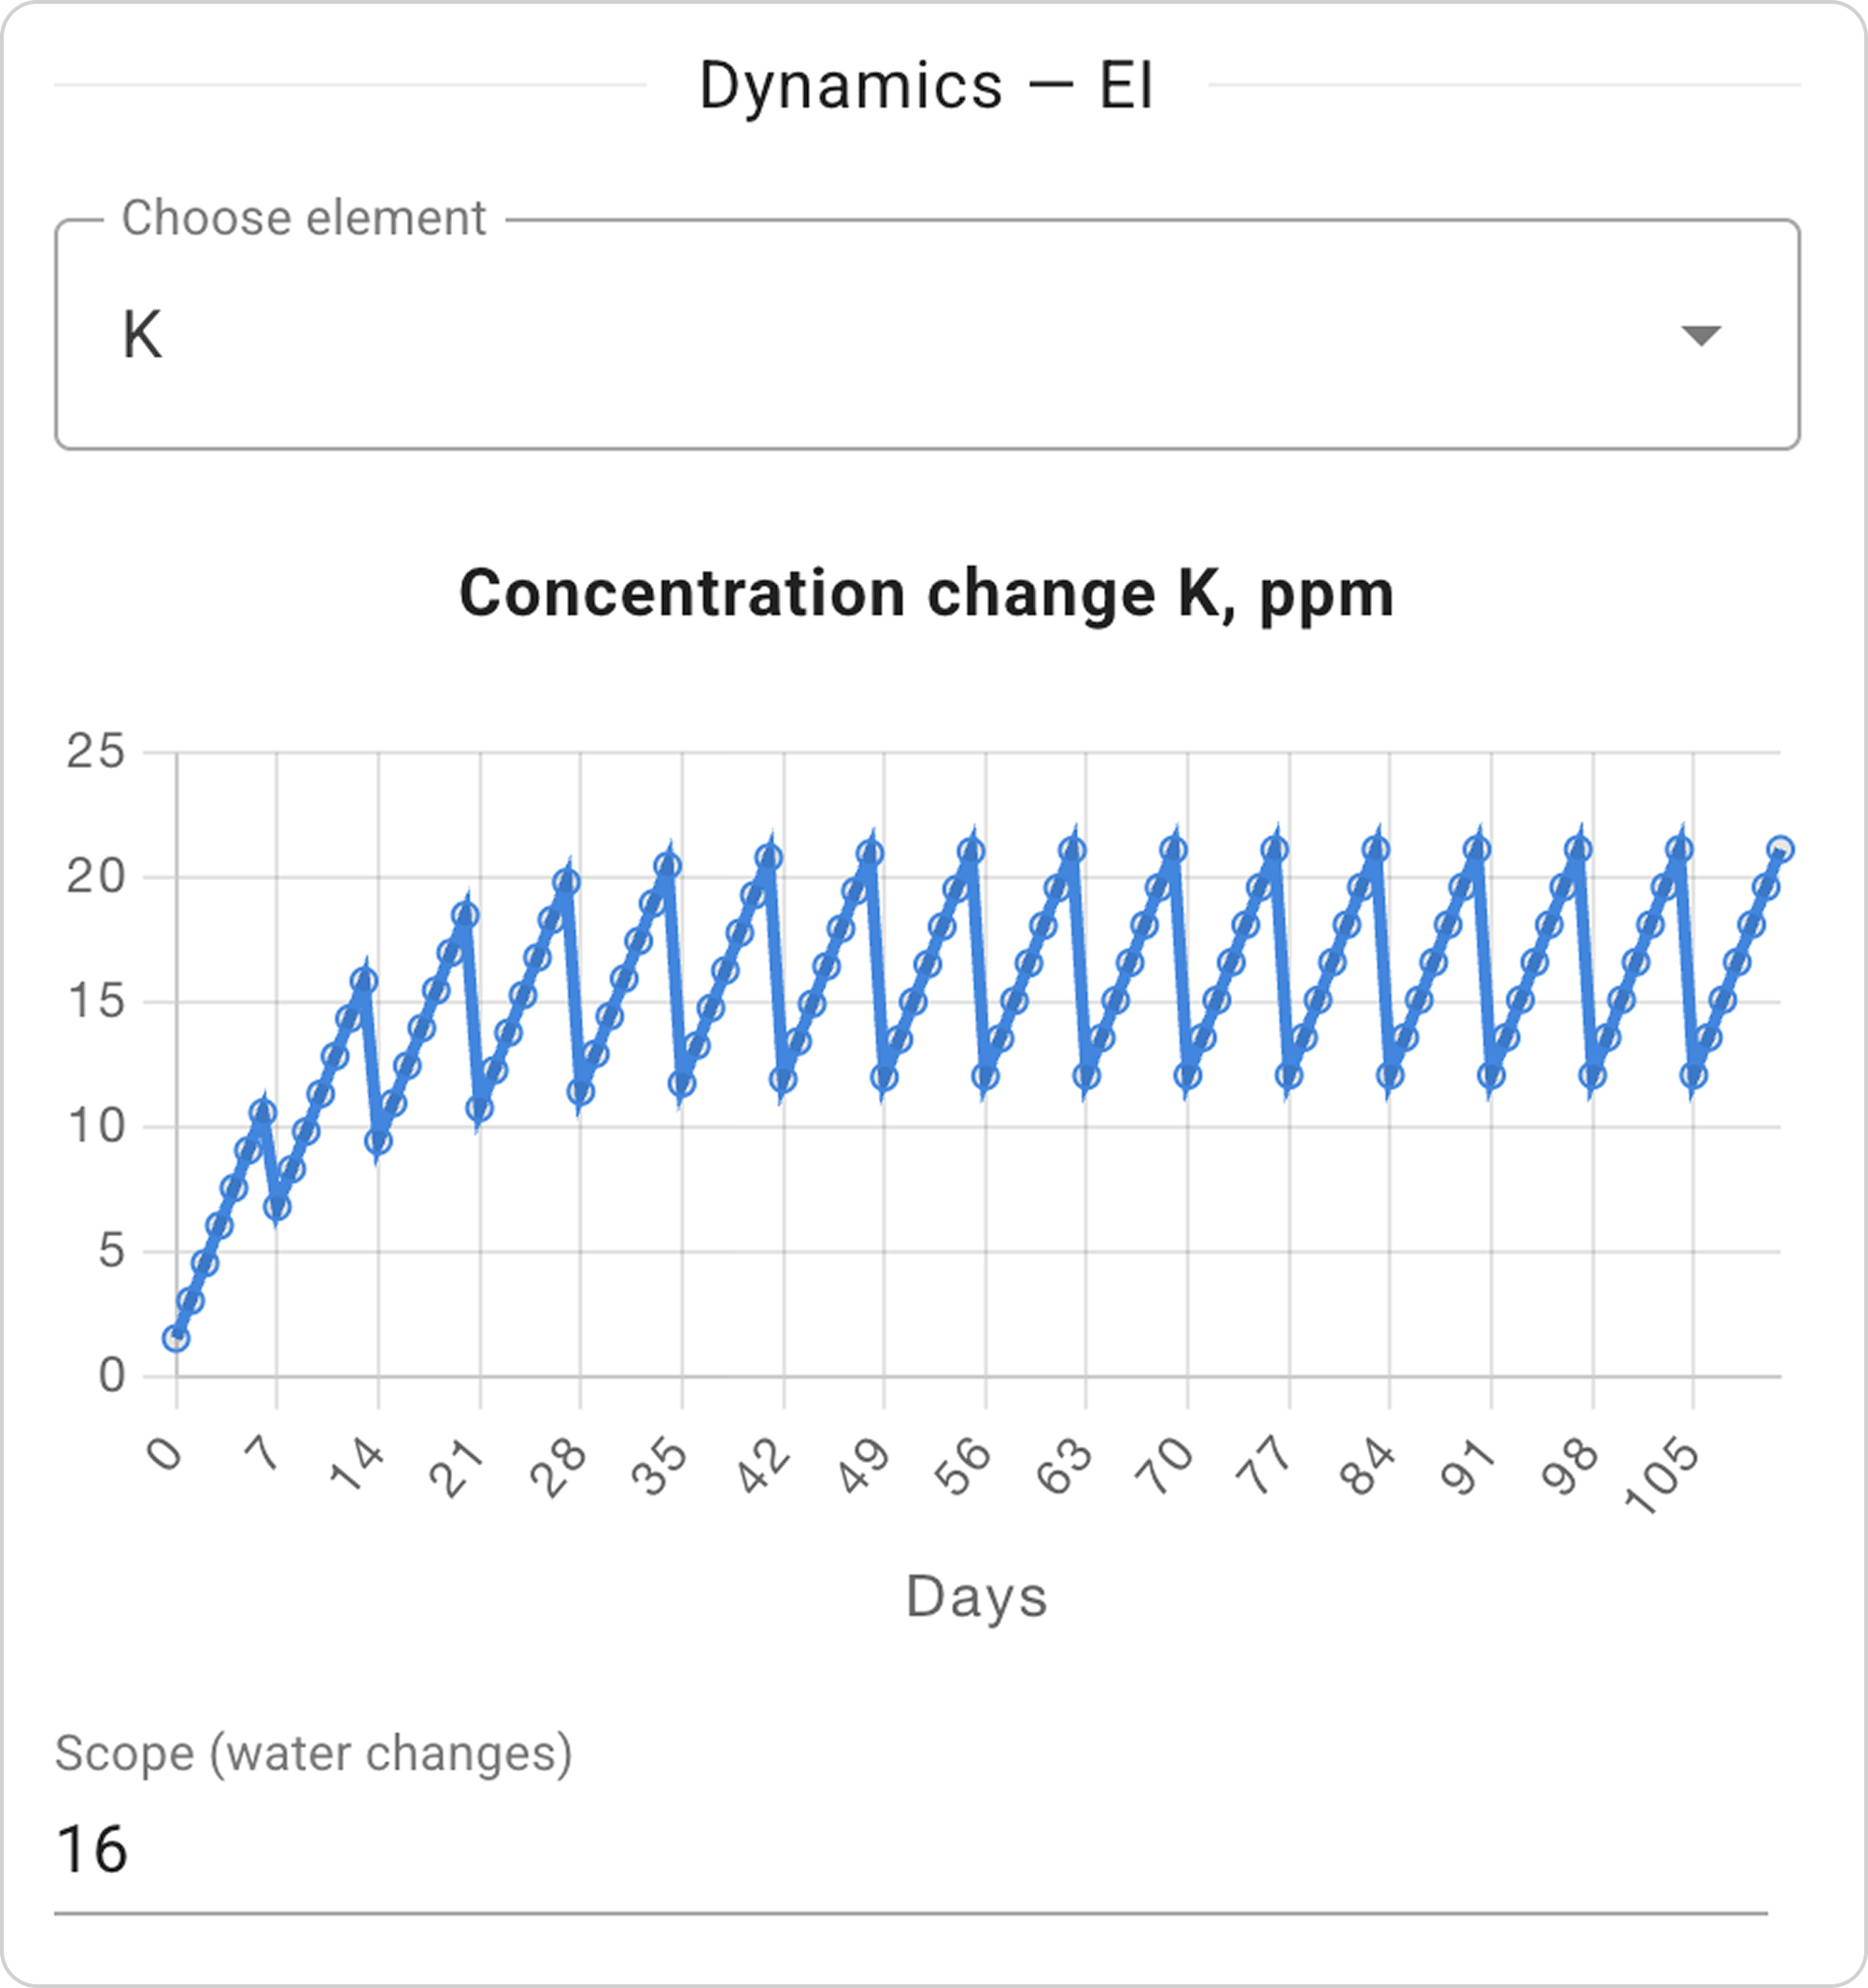
Using the potassium (K) graph as an example:
Horizontal axis (X): days from the start of fertilizer dosing (0, 7, 14, 21... up to 105 days)
Vertical axis (Y): Element concentration in mg/L (from 0 to 25 mg/L)
Curve characteristics:
- First weeks (days 1-14): Rapid growth
- Middle period (days 15-49): Gradual growth slowdown with characteristic "spikes"
- Final phase (days 50-105): Stabilization at 12-21 mg/L level
Tip: Practice has shown that the potassium accumulation graph allows determining its concentration in an aquarium with neutral substrate with high accuracy. This eliminates the need to purchase an expensive potassium test. More about potassium can be read here.
Understanding Concentration Ranges
Lower range boundary — concentration immediately after water change (when part of elements were "washed out")
Upper range boundary — peak concentration before the next water change (maximum accumulation in the period between weekly water changes)
Example for K: Range 12 — 21 mg/L means that potassium will fluctuate from 12 mg/L (after water change) to 21 mg/L (before the next water change).
Analyzing the "Sawtooth" Graph
Rises on the graph — daily element accumulation from fertilizer dosing
Drops on the graph — weekly water changes that reduce concentration
Curve stabilization — the moment when the system has reached equilibrium between element input and removal
Analyzing the Graph When Changing Water Change Quantity
- In the Scale (water changes) field, by default, the value is set at which equilibrium concentration is reached, but you can enter your own number of water changes and view graphs over shorter time periods.
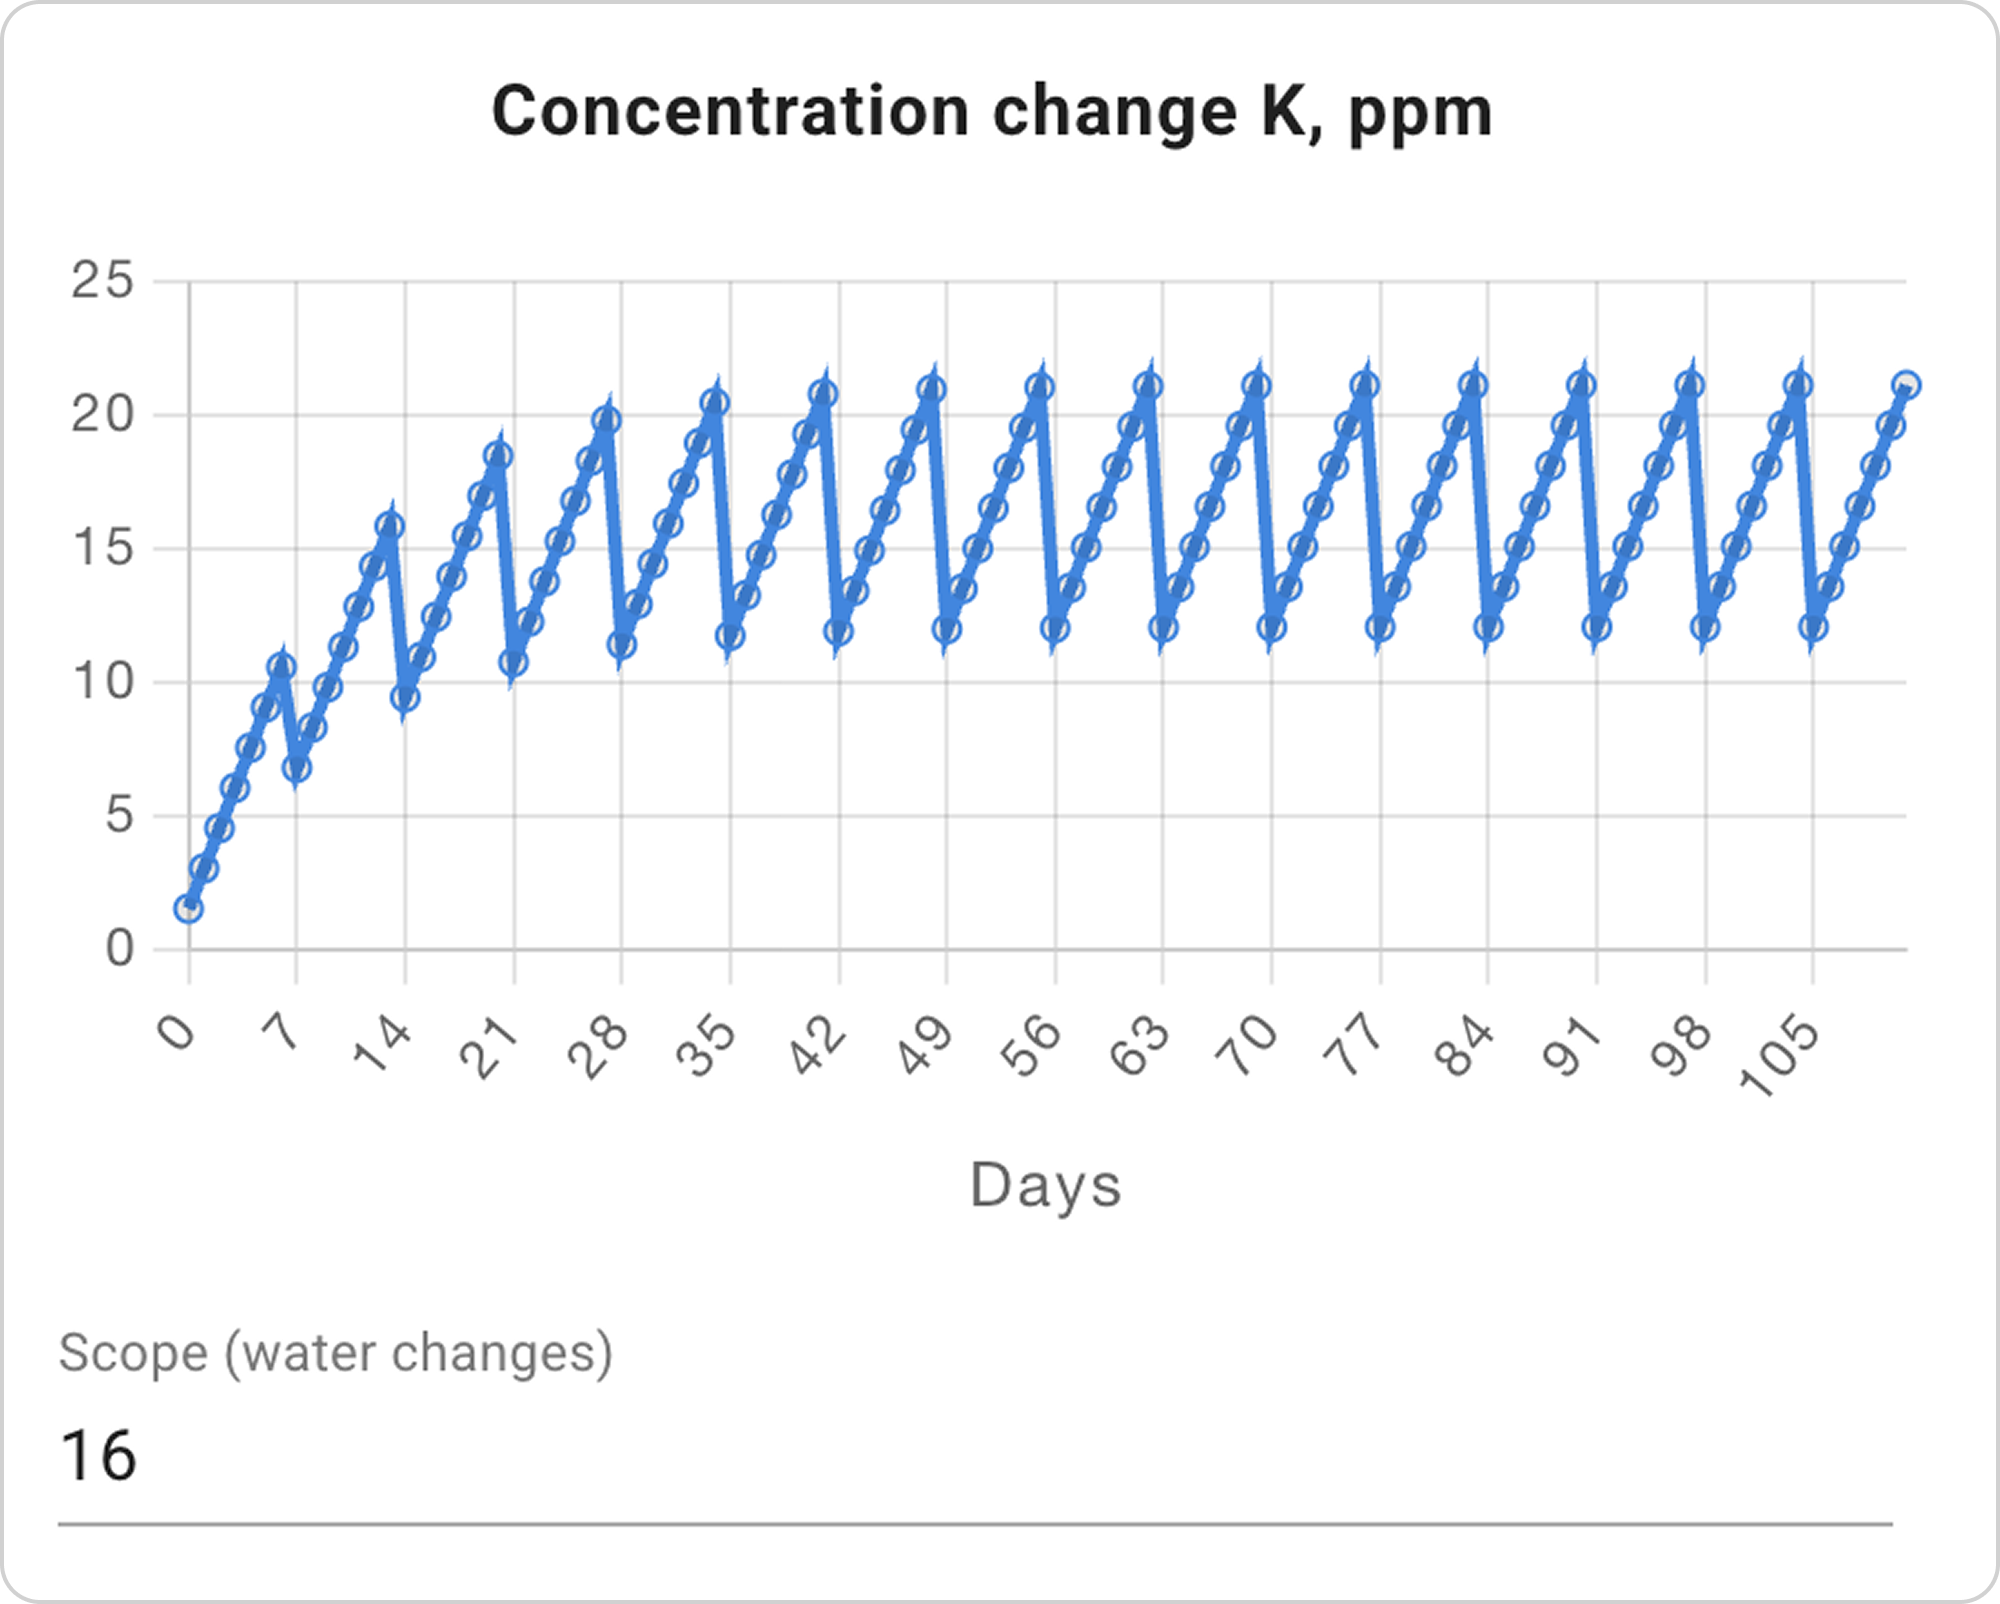
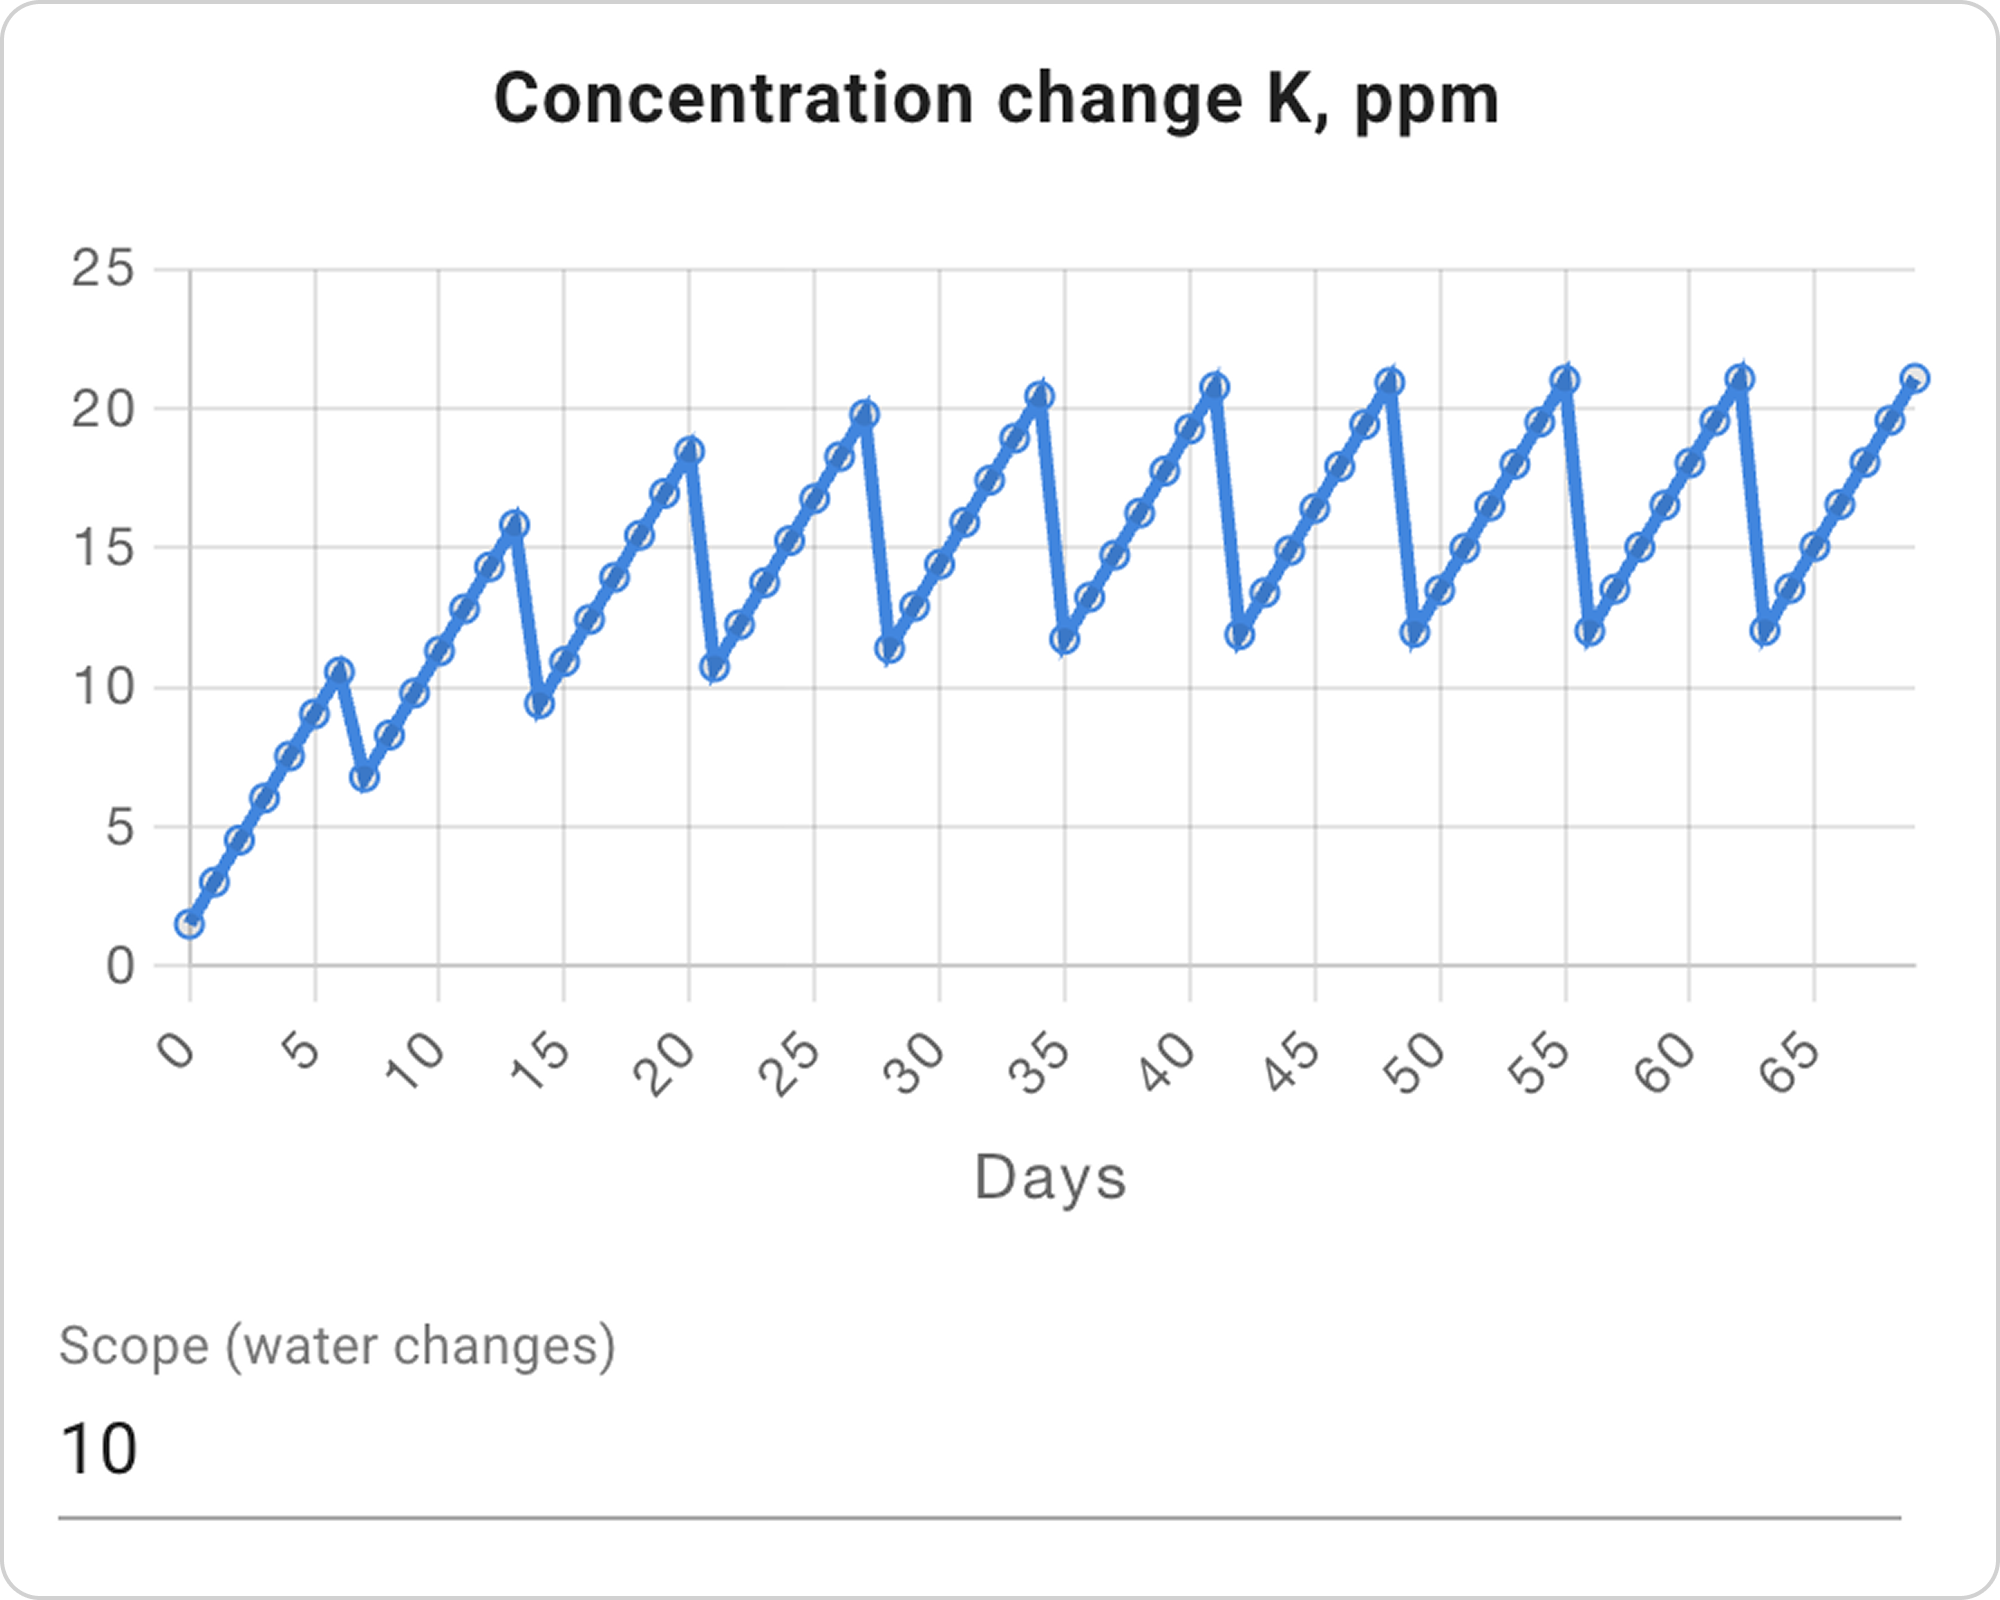
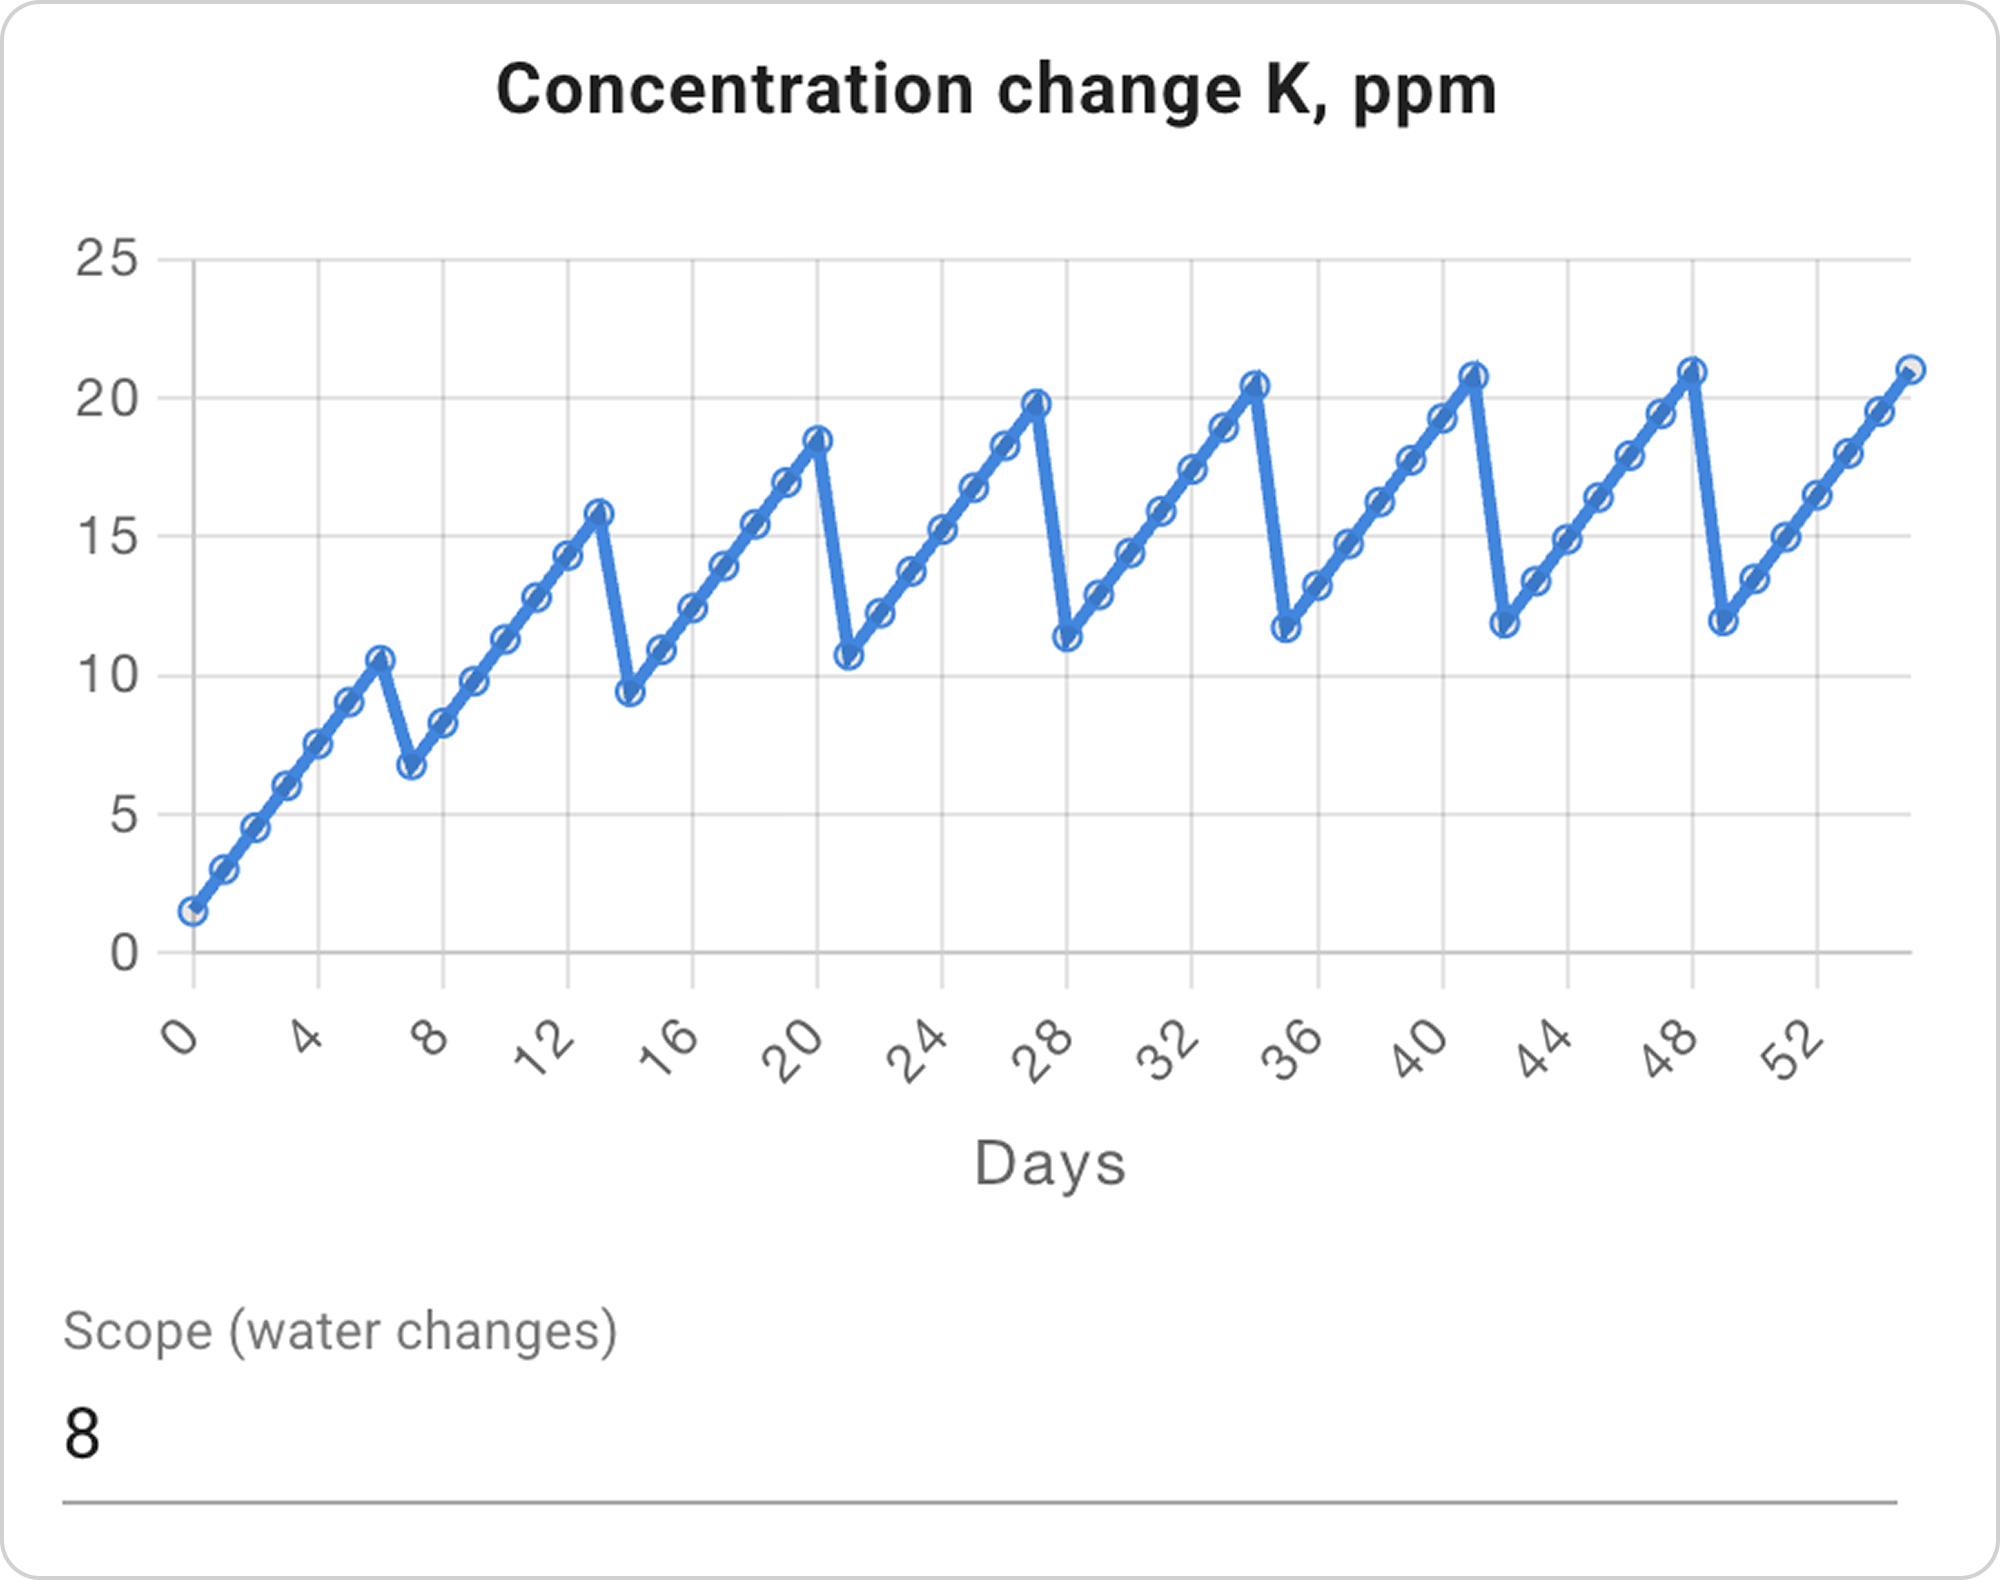
In our example: in the Scale field, enter values "10" and "8" sequentially.
- Optionally, analyze the graphs for all elements of interest to you.
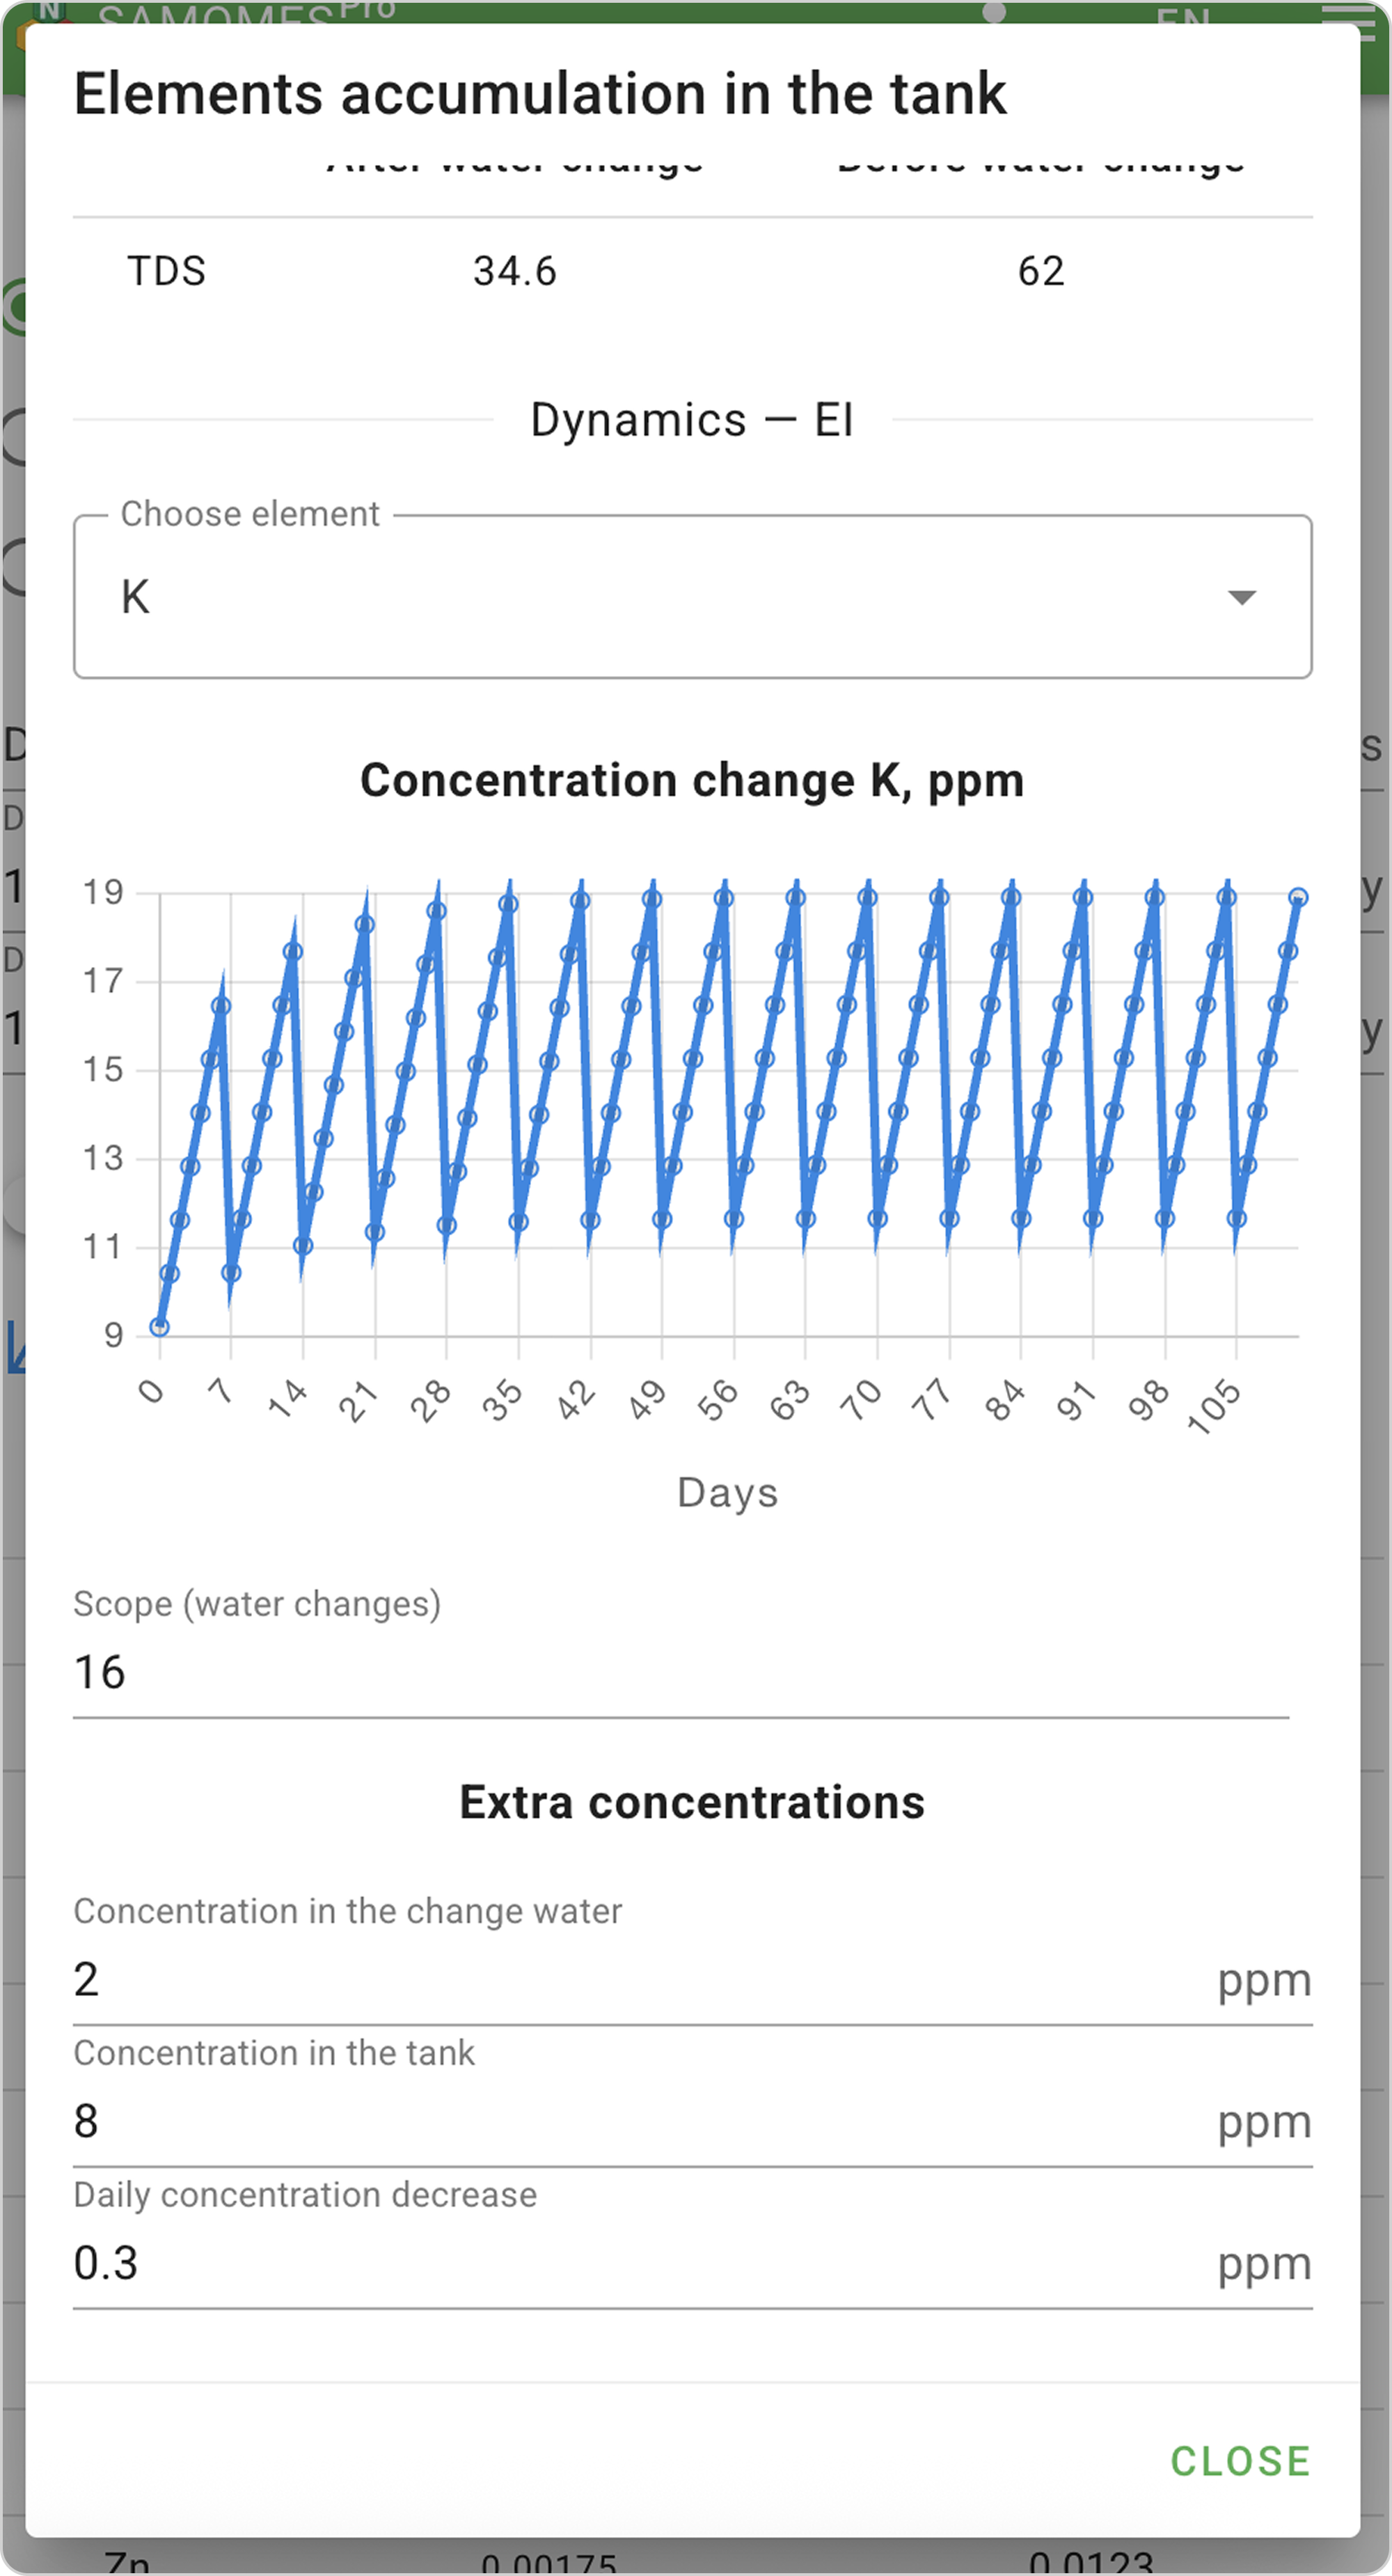
Step 4. Working with Additional Parameters
In the lower part of the window, you'll find three additional fields:
Concentration in the water change: 0 mg/L
- Specify here the element content in the water change (tap water or RO).
- In our example: Enter the value "2".
Concentration in the tank: 0 mg/L
- Enter the current potassium concentration.
- In our example: Enter the value "8".
Daily concentration decrease: 0 mg/L
- Specify daily element consumption by plants (this can be a value determined using tests or a theoretical assumption).
- In our example: Enter the value "0.3".
Step 5. Completion
- After finishing studying element accumulation in the aquarium, click "Close", and the system will return you to the Dosing section.